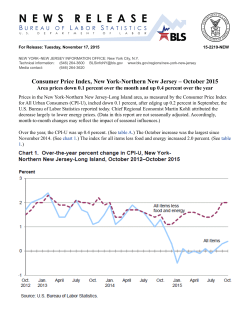
For Release: Tuesday, November 17, 2015
MID-ATLANTIC INFORMATION OFFICE: Philadelphia, Pa.
Technical information: (215) 597-3282 [email protected]
Media contact:
(215) 861-5600 [email protected]
15-2238-PHI
www.bls.gov/regions/mid-atlantic
Consumer Price Index, Northeast Region – October 2015
Regional prices down 0.2 percent over the month and 0.1 percent over the year
The Consumer Price Index for All Urban Consumers (CPI-U) in the Northeast edged down 0.2 percent in
October, the U.S. Bureau of Labor Statistics reported today. Sheila Watkins, the Bureau’s regional
commissioner, noted that a 3.6-percent decrease in the energy index was moderated by 0.1-percent increases
in both the all items less food and energy index and the food index. (Data in this report are not seasonally
adjusted. Accordingly, month-to-month changes may reflect the impact of seasonal influences.)
Over the last 12 months, the Northeast all items CPI-U inched down 0.1 percent. (See chart 1 and table A.)
The energy index fell 19.7 percent over the year, while the all items less food and energy index increased
1.8 percent. Food prices also advanced from October 2014, up 1.3 percent. (See table 1.)
Food
The food index inched up 0.1 percent since September. Food at home prices and food away from home
prices also rose 0.1 percent each over the month.
From October 2014 to October 2015, the food index increased 1.3 percent. Prices for food away from home
rose 2.1 percent over the year and those for food at home increased 0.9 percent.
Energy
The energy index, which includes prices for household and transportation fuels, decreased 3.6 percent since
September. This was led by a 5.3-percent decline in gasoline prices. Electricity and utility (piped) gas
service prices also decreased over the month, down 2.6 and 2.5 percent, respectively.
The energy index fell 19.7 percent since October 2014, due almost entirely to a 31.7-percent drop in
gasoline prices. Prices for utility (piped) gas service also dropped, down 12.6 percent, while electricity
prices increased 0.5 percent over the year.
All items less food and energy
The index for all items less food and energy increased 0.1 percent in October, led by higher prices for
medical care (0.5 percent) and education and communication (0.3 percent). Lower prices for apparel (-1.1
percent) and new and used motor vehicles (-0.7 percent) moderated the rise in the all items less food and
energy index since September.
Over the year, the index for all items less food and energy increased 1.8 percent, led by higher prices for
shelter (2.6 percent). Prices were also higher for several other categories including medical care and
education and communication, up 3.0 and 2.1 percent, respectively. Apparel prices were down 1.2 percent
over the year; household furnishings and operations prices declined 1.1 percent.
Table A. Northeast region CPI-U 1-month and 12-month percent changes, all items index, not seasonally
adjusted
2011
Month
January..............................................
February ............................................
March ................................................
April ...................................................
May....................................................
June...................................................
July ....................................................
August ...............................................
September.........................................
October..............................................
November..........................................
December..........................................
1-month
0.4
0.5
0.8
0.5
0.5
0.1
0.2
0.3
0.1
-0.1
-0.1
-0.3
2012
12month
1.6
2.0
2.5
2.8
3.2
3.4
3.6
3.8
4.0
3.6
3.2
2.9
1-month
2013
12month
0.4
0.4
0.5
0.3
-0.1
-0.2
-0.1
0.5
0.5
0.1
-0.2
-0.3
1-month
2.9
2.8
2.5
2.3
1.7
1.5
1.1
1.3
1.7
1.9
1.8
1.8
0.3
0.6
0.0
-0.1
0.0
0.1
0.2
0.2
0.1
-0.4
0.1
0.0
2014
12month
1.8
2.0
1.5
1.1
1.2
1.5
1.8
1.5
1.1
0.7
1.0
1.3
1-month
0.6
0.1
0.5
0.0
0.4
0.0
0.1
-0.3
0.0
-0.2
-0.4
-0.5
2015
12month
1.5
1.0
1.5
1.6
2.0
1.9
1.8
1.3
1.2
1.4
0.9
0.4
1-month
12month
-0.2
0.2
0.3
0.1
0.4
0.3
-0.1
-0.2
0.0
-0.2
-0.4
-0.2
-0.4
-0.3
-0.3
0.0
-0.2
-0.1
-0.1
-0.1
The Consumer Price Index for November 2015 is scheduled to be released Tuesday, December 15,
2015, at 8:30 a.m. (ET).
Technical Note
The Consumer Price Index (CPI) is a measure of the average change in prices over time in a fixed market
basket of goods and services. The Bureau of Labor Statistics publishes CPIs for two population groups: (1)
a CPI for All Urban Consumers (CPI-U) which covers approximately 89 percent of the total population and
(2) a CPI for Urban Wage Earners and Clerical Workers (CPI-W) which covers approximately 28 percent of
the total population. The CPI-U includes, in addition to wage earners and clerical workers, groups such as
professional, managerial, and technical workers, the self-employed, short-term workers, the unemployed,
and retirees and others not in the labor force.
2
The CPI is based on prices of food, clothing, shelter, and fuels, transportation fares, charges for doctors' and
dentists' services, drugs, and the other goods and services that people buy for day-to-day living. Each
month, prices are collected in 87 urban areas across the country from about 4,000 housing units and
approximately 26,000 retail establishments--department stores, supermarkets, hospitals, filling stations, and
other types of stores and service establishments. All taxes directly associated with the purchase and use of
items are included in the index.
The index measures price changes from a designated reference date (1982-84) that equals 100.0. An
increase of 16.5 percent, for example, is shown as 116.5. This change can also be expressed in dollars as
follows: the price of a base period "market basket" of goods and services in the CPI has risen from $10 in
1982-84 to $11.65. For further details see the CPI home page on the Internet at www.bls.gov/cpi and the
BLS Handbook of Methods, Chapter 17, The Consumer Price Index, available on the Internet at
www.bls.gov/opub/hom/homch17_a.htm.
In calculating the index, price changes for the various items in each location are averaged together with
weights that represent their importance in the spending of the appropriate population group. Local data are
then combined to obtain a U.S. city average. Because the sample size of a local area is smaller, the local
area index is subject to substantially more sampling and other measurement error than the national index. In
addition, local indexes are not adjusted for seasonal influences. As a result, local area indexes show greater
volatility than the national index, although their long-term trends are quite similar. Note: Area indexes do
not measure differences in the level of prices between cities; they only measure the average change in
prices for each area since the base period.
The Northeast region is comprised of Connecticut, Maine, Massachusetts, New Hampshire, New Jersey,
New York, Pennsylvania, Rhode Island, and Vermont.
Information in this release will be made available to sensory impaired individuals upon request. Voice
phone: (202) 691-5200; Federal Relay Service: (800) 877-8339.
3
Table 1. Consumer Price Index for All Urban Consumers (CPI-U): Indexes and percent changes for selected
periods, Northeast Region, (1982-84=100 unless otherwise noted) (not seasonally adjusted)
Percent change from
Indexes
Expenditure category
Historical
data
Aug.
2015
Sep.
2015
Oct.
2015
All items .......................................................
252.903
252.922
252.504
All items (December 1977 = 100)................
398.245
398.275
397.616
Food and beverages ...............................
252.060
252.559
Food .....................................................
252.149
252.707
Food at home ...................................
249.021
Food away from home......................
Oct.
2014
Aug.
2015
Sep.
2015
-0.1
-0.2
-0.2
252.759
1.3
0.3
0.1
252.919
1.3
0.3
0.1
249.251
249.465
0.9
0.2
0.1
259.933
260.986
261.198
2.1
0.5
0.1
Alcoholic beverages .............................
249.726
249.465
249.500
0.7
-0.1
0.0
Housing ...................................................
264.975
265.767
265.348
1.3
0.1
-0.2
Shelter ..................................................
326.509
327.736
327.847
2.6
0.4
0.0
Rent of primary residence (1) ............
326.086
328.146
328.864
3.1
0.9
0.2
Owners' equivalent rent of
residences (1) (2) ...............................
337.290
338.861
339.116
2.6
0.5
0.1
Owners' equivalent rent of primary
residence (1) (2) .............................
337.060
338.611
338.861
2.6
0.5
0.1
Fuels and utilities..................................
208.839
208.285
204.297
-6.1
-2.2
-1.9
Household energy ............................
184.901
184.239
179.901
-7.7
-2.7
-2.4
Energy services (1)........................
185.115
184.686
179.883
-2.9
-2.8
-2.6
(1) ...............................
198.006
197.596
192.385
0.5
-2.8
-2.6
Utility (piped) gas service (1) ......
144.401
143.950
140.377
-12.6
-2.8
-2.5
Household furnishings and operations .
122.483
122.855
123.219
-1.1
0.6
0.3
Apparel ....................................................
131.766
135.089
133.577
-1.2
1.4
-1.1
Transportation .........................................
201.447
197.063
194.865
-8.7
-3.3
-1.1
Private transportation ...........................
193.503
188.944
186.260
-9.5
-3.7
-1.4
(3) ......
98.407
98.191
97.504
-0.7
-0.9
-0.7
New vehicles ................................
145.295
145.681
145.103
0.5
-0.1
-0.4
New cars and trucks (3) (4) .........
100.687
100.955
100.560
0.6
-0.1
-0.4
New cars (4) ...............................
138.007
137.675
137.195
0.1
-0.6
-0.3
Used cars and trucks....................
158.308
155.663
152.746
-1.7
-3.5
-1.9
Motor fuel .........................................
217.280
198.489
187.946
-31.7
-13.5
-5.3
Gasoline (all types).......................
216.425
197.630
187.075
-31.7
-13.6
-5.3
Gasoline, unleaded regular (4) ...
214.499
194.913
184.097
-32.6
-14.2
-5.5
Gasoline, unleaded midgrade
(5) ...............................................
228.398
211.909
202.372
-28.6
-11.4
-4.5
Gasoline, unleaded premium (4) .
222.643
208.779
200.149
-26.1
-10.1
-4.1
Medical care ............................................
468.451
469.086
471.457
3.0
0.6
0.5
Medical care commodities....................
379.329
375.944
375.766
0.7
-0.9
0.0
Medical care services...........................
493.092
495.109
498.330
3.6
1.1
0.7
Professional services .......................
363.222
363.152
362.999
2.2
-0.1
0.0
Recreation (3) ...........................................
120.955
120.700
120.907
1.3
0.0
0.2
Education and communication (3) ............
139.296
140.674
141.127
2.1
1.3
0.3
Other goods and services .......................
452.607
452.607
454.368
2.2
0.4
0.4
188.337
187.271
186.071
-4.2
-1.2
-0.6
153.193
151.497
149.744
-7.8
-2.3
-1.2
Electricity
New and used motor vehicles
(4)
Commodity and service group
Commodities ...........................................
Commodities less food and beverages .
Note: See footnotes at end of table.
4
Table 1. Consumer Price Index for All Urban Consumers (CPI-U): Indexes and percent changes for selected
periods, Northeast Region, (1982-84=100 unless otherwise noted) (not seasonally adjusted) - Continued
Percent change from
Indexes
Expenditure category
Nondurables less food and
beverages.........................................
Historical
data
Aug.
2015
Sep.
2015
Oct.
2015
Oct.
2014
Aug.
2015
Sep.
2015
193.123
189.688
186.619
-11.6
-3.4
-1.6
Durables ...........................................
107.112
107.057
106.580
-1.1
-0.5
-0.4
Services...................................................
315.622
316.624
316.906
2.2
0.4
0.1
All items less shelter................................
227.776
227.339
226.717
-1.5
-0.5
-0.3
All items less medical care ......................
243.430
243.424
242.892
-0.3
-0.2
-0.2
Commodities less food ............................
156.728
155.069
153.363
-7.4
-2.1
-1.1
Nondurables ............................................
222.625
221.026
219.481
-5.0
-1.4
-0.7
Nondurables less food.............................
196.408
193.166
190.287
-10.8
-3.1
-1.5
Services less rent of shelter (2) ................
314.888
315.697
316.171
1.7
0.4
0.2
Services less medical care services........
303.327
304.262
304.366
2.1
0.3
0.0
Energy .....................................................
198.583
190.364
183.436
-19.7
-7.6
-3.6
All items less energy ...............................
260.984
261.856
262.108
1.7
0.4
0.1
All items less food and energy .............
264.244
265.178
265.439
1.8
0.5
0.1
Special aggregate indexes
Footnotes
(1) This index series was calculated using a Laspeyres estimator. All other item stratum index series were calculated using a geometric means
estimator.
(2) Indexes on a December 1982=100 base.
(3) Indexes on a December 1997=100 base.
(4) Special index based on a substantially smaller sample.
(5) Indexes on a December 1993=100 base.
Note: Index applies to a month as a whole, not to any specific date.
5
© Copyright 2026 Paperzz