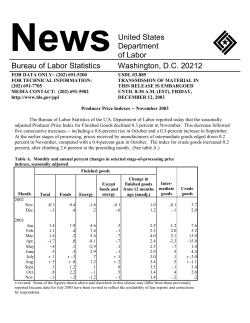
For Release: Wednesday, January 20, 2016
WESTERN INFORMATION OFFICE: San Francisco, Calif.
Technical information: (415) 625-2270 [email protected]
Media contact:
(415) 625-2270
16-124-SAN
www.bls.gov/regions/west
Consumer Price Index, San Diego - Second Half 2015
Area prices were up 1.6 percent over the past six months, up 2.4 percent from a year ago
Prices in the San Diego Area, as measured by the Consumer Price Index for All Urban Consumers (CPI-U),
increased 1.6 percent in the second half of 2015, the U.S. Bureau of Labor Statistics reported today. (See
table A.) Regional Commissioner Richard J. Holden noted that this latest six-month increase was influenced
by higher prices for shelter and recreation. (Data in this report are not seasonally adjusted. Accordingly, sixmonth-to-six-month changes may reflect seasonal influences.)
Over the last 12 months, the CPI-U advanced 2.4 percent. (See chart 1 and table A.) Energy prices fell 3.8
percent, largely the result of a decrease in the price of gasoline. The index for all items less food and energy
advanced 3.1 percent over the year. (See table 1.)
Food
Food prices increased 1.4 percent in the second half of 2015. (See table 1.) Prices for food away from home
increased 2.4 percent, and prices for food at home rose 0.6 percent for the same period.
Over the year, food prices advanced 1.8 percent. Prices for food away from home increased 3.7 percent
since a year ago, and prices for food at home rose 0.1 percent.
Energy
The energy index increased 0.9 percent since the first half of 2015. The increase was mainly due to higher
prices for electricity (2.4 percent). Prices for natural gas service increased 1.8 percent, and prices for
gasoline rose 0.1 percent for the same period.
Energy prices fell 3.8 percent over the year, largely due to lower prices for gasoline (-8.4 percent). Prices
paid for natural gas service decreased 1.3 percent, but prices for electricity increased 7.4 percent during the
past year.
All items less food and energy
The index for all items less food and energy rose 1.6 percent in the latest six-month period. Components
contributing to the increase included shelter (2.3 percent) and recreation (2.3 percent).
Over the year, the index for all items less food and energy advanced 3.1 percent. Components contributing
to the increase included apparel (6.5 percent) and shelter (4.3 percent). Partly offsetting the increases were
price declines in education and communication (-0.7 percent) and other goods and services (-0.2 percent).
Table A. San Diego CPI-U monthly and annual percent changes (not seasonally adjusted)
2010
Month
First Half .......................................
Second Half..................................
Semiannual
0.2
1.0
2011
Annual
Semiannual
1.4
1.2
2.3
0.4
2012
Annual
Semiannual
3.4
2.7
1.3
0.3
2013
Annual
Semiannual
1.7
1.5
0.6
1.1
2014
Annual
Semiannual
0.9
1.7
1.4
-0.1
2015
Annual
Semiannual
Annual
2.4
1.3
0.9
1.6
0.8
2.4
The First Half of 2016 Consumer Price Index for the San Diego is scheduled to be released on July 15,
2016.
Technical Note
The Consumer Price Index (CPI) is a measure of the average change in prices over time in a fixed market
basket of goods and services. The Bureau of Labor Statistics publishes CPIs for two population groups: (1)
a CPI for All Urban Consumers (CPI-U) which covers approximately 89 percent of the total population and
(2) a CPI for Urban Wage Earners and Clerical Workers (CPI-W) which covers 28 percent of the total
population. The CPI-U includes, in addition to wage earners and clerical workers, groups such as
professional, managerial, and technical workers, the self-employed, short-term workers, the unemployed,
and retirees and others not in the labor force.
The CPI is based on prices of food, clothing, shelter, and fuels, transportation fares, charges for doctors' and
dentists' services, drugs, and the other goods and services that people buy for day-to-day living. Each
month, prices are collected in 87 urban areas across the country from about 6,000 housing units and
approximately 24,000 retail establishments--department stores, supermarkets, hospitals, filling stations, and
other types of stores and service establishments. All taxes directly associated with the purchase and use of
items are included in the index.
The index measures price changes from a designated reference date (1982-84) that equals 100.0. An
increase of 16.5 percent, for example, is shown as 116.5. This change can also be expressed in dollars as
follows: the price of a base period "market basket" of goods and services in the CPI has risen from $10 in
2
1982-84 to $11.65. For further details see the CPI home page on the Internet at www.bls.gov/cpi and the
BLS Handbook of Methods, Chapter 17, The Consumer Price Index, available on the Internet at
www.bls.gov/opub/hom/homch17_a.htm.
In calculating the index, price changes for the various items in each location are averaged together with
weights that represent their importance in the spending of the appropriate population group. Local data are
then combined to obtain a U.S. city average. Because the sample size of a local area is smaller, the local
area index is subject to substantially more sampling and other measurement error than the national index. In
addition, local indexes are not adjusted for seasonal influences. As a result, local area indexes show greater
volatility than the national index, although their long-term trends are quite similar. NOTE: Area indexes do
not measure differences in the level of prices between cities; they only measure the average change in
prices for each area since the base period.
The San Diego, CA metropolitan area covered in this release consists of San Diego County in the State of
California.
Information in this release will be made available to sensory impaired individuals upon request. Voice
phone: (202) 691-5200; Federal Relay Service: (800) 877-8339.
3
Table 1. Consumer Price Index for All Urban Consumers (CPI-U): Indexes for semiannual averages and
percent changes for selected periods San Diego, CA (1982-84=100 unless otherwise noted)
Semiannual average indexes
Item and Group
2nd half
2014
1st half
2015
Percent change to
2nd half 2015 from2nd half
2015
2nd half
2014
1st half
2015
Expenditure category
All items .................................................................
All items (1967=100) .............................................
Food and beverages .........................................
Food ...............................................................
Food at home .............................................
Food away from home................................
Alcoholic beverages .......................................
Housing .............................................................
Shelter ............................................................
Rent of primary residence ..........................
265.039
896.178
244.716
241.836
225.005
263.314
266.241
294.532
329.977
322.979
267.346
903.977
245.892
242.713
223.746
266.663
270.694
300.113
336.524
329.807
271.526
918.113
249.132
246.216
225.186
272.984
270.880
306.480
344.181
337.405
2.4
1.8
1.8
0.1
3.7
1.7
4.1
4.3
4.5
1.6
1.3
1.4
0.6
2.4
0.1
2.1
2.3
2.3
Owners' equiv. rent of residences (1) ..........
351.241
358.339
365.724
4.1
2.1
Owners' equiv. rent of primary residence
(1) ............................................................
351.241
358.339
365.724
4.1
2.1
Fuels and utilities............................................
Household energy ......................................
Energy services......................................
Electricity .............................................
Utility (piped) gas service ....................
Household furnishings and operations ...........
Apparel ..............................................................
Transportation ...................................................
Private transportation .....................................
Motor fuel ...................................................
Gasoline (all types).................................
270.773
237.777
232.333
220.539
196.419
182.221
135.721
218.362
209.886
284.058
283.979
276.688
244.848
239.701
231.328
190.601
183.531
142.571
213.587
204.296
259.482
259.634
281.951
250.290
245.151
236.897
193.952
185.266
144.477
215.297
207.683
259.681
259.987
4.1
5.3
5.5
7.4
-1.3
1.7
6.5
-1.4
-1.0
-8.6
-8.4
1.9
2.2
2.3
2.4
1.8
0.9
1.3
0.8
1.7
0.1
0.1
Gasoline, unleaded regular (2) .............
295.533
269.850
269.791
-8.7
0.0
Gasoline, unleaded midgrade (2) (3) .....
242.955
222.721
224.045
-7.8
0.6
Gasoline, unleaded premium (2) ..........
286.446
262.957
264.272
-7.7
0.5
Medical care ......................................................
-
-
-
-
-
Recreation (4) .....................................................
148.738
146.264
149.623
0.6
2.3
Education and communication (4) ......................
146.694
145.187
145.705
-0.7
0.4
Other goods and services .................................
370.999
365.906
370.311
-0.2
1.2
265.039
197.980
173.024
194.996
149.613
324.358
267.346
196.178
169.752
190.045
148.717
330.201
271.526
197.256
169.738
191.030
147.191
337.066
2.4
-0.4
-1.9
-2.0
-1.6
3.9
1.6
0.5
0.0
0.5
-1.0
2.1
All items less medical care ....................................
All items less shelter..............................................
Commodities less food ..........................................
Nondurables ..........................................................
Nondurables less food...........................................
257.417
240.352
177.202
221.091
201.521
259.151
240.755
174.229
218.911
197.145
263.430
243.430
174.224
220.963
198.086
2.3
1.3
-1.7
-0.1
-1.7
1.7
1.1
0.0
0.9
0.5
Services less rent of shelter (1) ..............................
335.845
340.928
347.016
3.3
1.8
Services less medical care services......................
Energy ...................................................................
All items less energy .............................................
313.695
261.787
267.150
318.641
249.757
270.683
325.600
251.966
275.057
3.8
-3.8
3.0
2.2
0.9
1.6
Commodity and service group
All Items.................................................................
Commodities .....................................................
Commodities less food & beverages..............
Nondurables less food & beverages ..........
Durables .....................................................
Services.............................................................
Special aggregate indexes
Note: See footnotes at end of table.
4
Table 1. Consumer Price Index for All Urban Consumers (CPI-U): Indexes for semiannual averages and
percent changes for selected periods San Diego, CA (1982-84=100 unless otherwise noted) - Continued
Semiannual average indexes
Item and Group
2nd half
2014
All items less food and energy ..........................
1st half
2015
273.026
277.064
Footnotes
(1) Index is on a December 1982=100 base.
(2) Special index based on a substantially smaller sample.
(3) Indexes on a December 1993=100 base.
(4) Indexes on a December 1997=100 base.
- Data not available.
5
Percent change to
2nd half 2015 from2nd half
2015
281.618
2nd half
2014
1st half
2015
3.1
1.6
© Copyright 2026 Paperzz