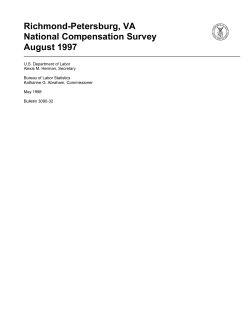
Buffalo-Niagara Falls, NY
National Compensation Survey
July 1998
________________________________________________________________________________________________
U.S. Department of Labor
Alexis M. Herman, Secretary
Bureau of Labor Statistics
Katharine G. Abraham, Commissioner
July 1999
Bulletin 3095-24
Buffalo-Niagara Falls, NY
Metropolitan Statistical Area
Niagara
Niagara Falls
Erie
Buffalo
Preface
T
For additional information regarding this survey, please
contact the BLS New York Regional Office at (212) 3372400. You may also write to the Bureau of Labor Statistics
at: Division of Compensation Data Analysis and Planning,
2 Massachusetts Avenue, NE, Room 4175, Washington,
DC 20212-0001, or call (202) 606-6220, or send e-mail to
[email protected].
The data contained in this bulletin are also available at
the BLS Internet site (https://www.bls.gov/ocs/#data ).
Data are in three formats: an ASCII file containing the
published table formats; an ASCII file containing positional
columns of data for manipulation as a data base or spreadsheet; and a Portable Document Format (PDF) file containing the entire bulletin.
Material in this bulletin is in the public domain and,
with appropriate credit, may be reproduced without permission. This information will be made available to sensory
impaired individuals upon request. Voice phone: (202)
606-7828; Federal Relay Service: 1-800-877-8339.
his bulletin provides results of a July 1998 survey of
occupational pay in the Buffalo-Niagara Falls, NY
Metropolitan Statistical Area (MSA). Data shown in this
bulletin were collected as part of the Bureau of Labor Statistics’ (BLS) new program known as the National Compensation Survey (NCS).
The survey could not have been conducted without the
cooperation of the many private firms and government jurisdictions that provided pay data included in this bulletin.
The Bureau thanks these respondents for their cooperation.
Survey data were collected and reviewed by Bureau of
Labor Statistics field economists under the direction of the
Assistant Regional Commissioner for Operations of the
New York Regional Office. The Office of Compensation
and Working Conditions, in cooperation with the Office of
Field Operations and the Office of Technology and Survey
Processing in the BLS National Office, designed the survey, processed the data, and analyzed the survey results.
iii
Contents
Page
Introduction ................................................................................................................................................
Wages in the Buffalo-Niagara Falls, NY, MSA .........................................................................................
1
2
Tables:
A-1. Hourly earnings for selected occupations, all workers, all industries ...........................................
A-2. Hourly earnings for selected occupations, all workers, private industry and
State and local government...........................................................................................................
A-3. Hourly earnings for selected occupations, full-time and part-time workers,
all industries .................................................................................................................................
A-4. Weekly and annual earnings and hours for selected occupations,
full-time workers only, all industries ............................................................................................
B-1. Mean hourly earnings by occupational group and levels, all industries,
private industry, State and local government, full-time and part-time workers ............................
B-2. Mean hourly earnings for selected occupations and levels, all industries,
private industry, State and local government, full-time and part-time workers ............................
C-1. Mean hourly earnings by occupational group and selected characteristics,
all industries .................................................................................................................................
C-2. Mean hourly earnings by occupational group and industry division,
private industry, all workers .........................................................................................................
C-3. Mean hourly earnings by occupational group and establishment employment size,
private industry, all workers .........................................................................................................
C-4. Number of workers represented by occupational group ...............................................................
4
7
10
13
15
18
21
22
23
24
Appendix A:
Technical Note .....................................................................................................................................
Appendix table 1. Number of establishments studied and represented............................................
Appendix table 2. Relative standard errors......................................................................................
Appendix table 3. Average work levels ...........................................................................................
v
25
29
30
33
Introduction
T
NCS more extensive than OCS
The wage data in this bulletin differ from those in previous
Occupational Compensation Surveys by providing broader
coverage of occupations and establishments within the survey area.
Occupations surveyed for this bulletin were selected
using probability techniques from a list of all those present
in each establishment. Previous OCS bulletins were limited to a preselected list of occupations, which represented
a small subset of all occupations in the economy. Information in the new bulletin is published for a variety of occupation-based data. This new approach includes data on
broad occupational classifications such as white-collar
workers, major occupational groups such as sales workers,
and individual occupations such as cashiers.
In tables containing work levels within occupational series, the work levels are derived from generic standards that
apply to all occupational groups. The job levels in the
OCS bulletins were based on narrowly-defined descriptions
that were not comparable across specific occupations.
Occupational data in this bulletin are also tabulated for
other classifications such as industry group, full-time versus part-time workers, union versus nonunion status, time
versus incentive status, and establishment employment size.
Not all of these series were generated by the OCS program.
The establishments surveyed for this bulletin were limited to those with 50 or more employees. Eventually, NCS
will be expanded to cover those now-excluded establishments. Then, virtually all workers in the civilian economy
will be surveyed, excluding only agriculture, private households, and employees of the Federal government.
his survey of occupational pay was conducted in the
Buffalo-Niagara Falls, NY, Metropolitan Statistical
Area (MSA). The MSA includes Erie and Niagara
Counties.
This bulletin consists primarily of tables whose data are
analyzed in the initial textual section. Tabulations provide
information on earnings of workers in a variety of occupations and at a wide range of work levels. Also contained in
this bulletin is information on the program, a technical note
describing survey procedures, and several appendixes with
detailed information on occupational classifications and the
generic leveling methodology.
NCS design and products
The Bureau of Labor Statistics' (BLS) new National Compensation Survey (NCS) is designed to provide data on the
levels and rates of change of occupational wages and employee benefits for localities, broad geographic regions,
and the nation as a whole. One output of the NCS will be
the Employment Cost Index, a quarterly measure of the
change in employer costs for wages and benefits. This
bulletin is limited to data on wages and salaries. These
data are similar to those released under the Occupational
Compensation Survey (OCS), which has been discontinued.
Due to the limited amount of time available to initiate
this first phase of the new program, a number of companies
were unable to provide complete data before the publication deadline. As a result, some surveys have a high nonresponse rate for the all industries or the private industry iterations. Such instances are noted in the bulletin table
footnotes.
1
Wages in the
Buffalo-Niagara Falls, NY
Metropolitan Statistical Area
S
Survey results show that private industry workers in
Buffalo-Niagara Falls, NY earned $14.44 per hour, while
surveyed State and local government workers averaged
$20.19. Table A-2 reports the average hourly rate for
white-collar occupations as $15.97 in private industry and
$23.40 in State and local government. Blue-collar occupations showed an average hourly rate of $14.50 in private
industry and $14.89 in State and local government. Service
occupations within private industry averaged $7.59 per
hour while those found in State and local government averaged $15.46.
traight-time wages in the Buffalo-Niagara Falls, NY,
Metropolitan Statistical Area averaged $15.73 per hour
during July 1998. White-collar workers had an average
wage of $17.96 per hour. Blue-collar workers averaged
$14.54 per hour, while service workers had average earnings of $10.51 per hour. (All hourly rates in this summary
cover both full- and part-time workers, unless otherwise
noted.)
Chart 1. Average hourly wage rates by occupational
group, Buffalo-Niagara Falls, NY, July 1998
Chart 2. Average hourly rates for private industry and
State and local government, Buffalo-Niagara Falls, NY,
July 1998
Dollars per hour
$ 20
Dollars per hour
$
25
15
20
10
15
5
10
0
5
Whitecollar
Bluecollar
Service
workers
0
White-collar
Within each of these occupational groups, average
hourly wages for individual occupations were estimated.
For example, white-collar occupations included registered
nurses at $18.81 per hour, secretaries at $12.64, and general office clerks at $11.12. Among occupations in the
blue-collar category, truck drivers averaged $12.61 per
hour while stock handlers and baggers averaged $8.53. Finally, service occupations included janitors and cleaners at
$10.06 per hour and nursing aides, orderlies and attendants
at $8.66 per hour. Table A-1 presents earnings data for 73
detailed occupations; data for other detailed occupations
surveyed could not be reported separately due to concerns
about the confidentiality of survey respondents and the reliability of the data.
Private industry
Blue-collar
Service
State and local government
Table A-3 presents data for workers considered by the
survey respondents to be either full-time or part-time. Average wages for full-time workers, all occupations, were
$16.85 per hour, compared with an average of $8.74 per
hour for part-time workers.
Data for specific work levels within major occupational
groups are reported in table B-1. Occasionally, wage estimates for lower levels of work within major occupational
groups are greater than estimates for higher levels. This
can occur due to the mix of specific occupations (and industries) represented by the broad group as well as by the
2
Table C-2 shows wage data for specific industry divisions within private industry. In the private sector, hourly
wages averaged $17.51 in all goods-producing industries,
and $17.80 in manufacturing. Data for other industry divisions did not meet publication criteria.
Table C-4 reports that a total of 303,797 workers were
represented by the Buffalo-Niagara Falls, NY survey.
White-collar occupations included 159,664 workers, or 53
percent, blue-collar occupations included 96,591 workers,
or 32 percent; and service occupations included 47,541
workers, or 16 percent.
variability of the estimate. Some levels within a group may
not be published because no workers were identified at that
level or because there were not enough data to guarantee
confidentiality and reliability.
Work levels for all major groups span several levels,
with professional specialty occupations and executive, administrative, and managerial occupations typically starting
and ending at higher work levels than the other groups.
Published data for administrative support occupations, including clerical, ranged from level 1 to level 7. As illustrated in chart 3, the average hourly rate was $7.44 for level
1, $9.55 for level 3, $13.20 for level 5, and $19.06 for level
7.
Chart 4. Distribution of workers represented by
occupational group, Buffalo-Niagara Falls, NY, July 1998
Chart 3. Average hourly rates by work level for
administrative support occupations, including
clerical, Buffalo-Niagara Falls, NY, July 1998
Percent
60
Dollars per hour
$20
50
40
15
30
20
10
10
5
0
0
1
3
5
Whitecollar
Bluecollar
Service
workers
7
Level
Data are also presented in appendix table 1 on the number of establishments studied by industry group and employment size. The relative standard errors of published
mean hourly earnings for all industries, private industry,
and State and local government are available in appendix
table 2. The average work levels for published occupational groups and selected occupations are presented in appendix table 3.
Surveyed union workers had an average hourly rate of
$17.63, as reported in table C-1. Wages for nonunion
workers averaged $14.13. Time workers, whose wages
were based solely on an hourly rate or a salary, averaged
$15.77 per hour. Incentive workers, whose wages were at
least partially based on productivity payments, averaged
$14.61 per hour.
3
Table A-1. Hourly earnings1 for selected occupations, all workers2, all industries,
Buffalo-Niagara Falls, NY, July 1998
All industries
Percentiles
Occupation3
Mean
10
All occupations ....................................................................... $15.73
All occupations excluding sales ............................................ 16.01
$6.82
7.00
25
Median
50
$9.05 $13.79
9.31 14.04
75
90
$19.91
20.06
$26.31
26.60
White-collar occupations ...................................................
White-collar occupations excluding sales .........................
17.96
18.83
7.35
8.00
10.00
10.96
14.72
15.86
22.55
23.42
31.78
33.32
Professional specialty and technical occupations ............
Professional specialty occupations ...............................
Engineers, architects, and surveyors .......................
Electrical and electronic engineers .......................
Industrial engineers ..............................................
Engineers, N.E.C. .................................................
Mathematical and computer scientists .....................
Computer systems analysts and scientists ...........
Natural scientists ......................................................
Health related occupations .......................................
Registered nurses ................................................
Pharmacists ..........................................................
Teachers, college and university ..............................
Teachers, post secondary N.E.C. .........................
Teachers, except college and university ..................
Elementary school teachers .................................
Secondary school teachers ..................................
Librarians, archivists, and curators ...........................
Librarians ..............................................................
Social scientists and urban planners ........................
Social, recreation, and religious workers ..................
Social workers ......................................................
Lawyers and judges ..................................................
Writers, authors, entertainers, athletes, and
professionals, N.E.C. ..........................................
Technical occupations ..................................................
Clinical laboratory technologists and technicians
Licensed practical nurses .....................................
Health technologists and technicians, N.E.C. .......
Electrical and electronic technicians .....................
Drafters .................................................................
Executive, administrative, and managerial occupations ...
Executives, administrators, and managers ...............
Financial managers ..............................................
Managers, marketing, advertising and public
relations ..........................................................
Administrators, education and related fields .........
Managers, service organizations, N.E.C. .............
Managers and administrators, N.E.C. ..................
Management related occupations ............................
Accountants and auditors .....................................
Management related occupations, N.E.C. ............
Sales occupations ............................................................
Supervisors, sales occupations ............................
Sales workers, other commodities ........................
Cashiers ...............................................................
Administrative support occupations, including clerical .....
Supervisors, financial records processing ............
Computer operators ..............................................
Secretaries ...........................................................
Typists ..................................................................
Receptionists ........................................................
Information clerks, N.E.C. .....................................
Order clerks ..........................................................
Library clerks ........................................................
Records clerks, N.E.C. .........................................
Bookkeepers, accounting and auditing clerks ......
Traffic, shipping and receiving clerks ...................
General office clerks .............................................
Data entry keyers .................................................
23.96
26.47
27.21
25.63
22.12
30.85
23.44
22.89
–
21.16
18.81
26.54
44.11
33.49
32.53
33.42
31.55
21.63
21.63
–
15.12
14.87
–
12.05
14.87
18.44
21.30
15.71
19.02
20.00
20.00
–
15.44
15.74
20.78
22.83
25.68
15.60
15.70
18.76
14.04
14.04
–
7.60
7.24
–
15.89
18.43
22.83
24.76
17.07
26.78
21.35
21.35
–
17.62
17.21
25.60
29.47
27.63
23.15
22.91
23.86
14.04
14.04
–
10.78
9.43
–
20.78
22.97
26.78
25.70
21.21
30.44
22.84
22.07
–
19.62
18.91
26.76
36.17
34.67
31.59
32.82
30.34
19.50
19.50
–
14.87
14.87
–
28.62
31.23
31.25
26.55
27.56
35.84
24.62
23.95
–
21.93
20.62
27.36
57.30
37.15
42.28
43.26
40.70
22.94
22.94
–
19.73
19.73
–
40.35
43.65
35.84
29.21
28.88
44.32
29.66
28.85
–
27.71
21.76
30.16
80.93
42.93
50.64
52.41
45.22
46.81
46.81
–
22.97
24.33
–
19.92
14.53
17.18
12.30
12.98
15.61
17.61
27.06
29.55
35.67
11.74
10.41
11.72
9.79
10.41
10.22
15.14
14.93
19.31
22.50
15.90
11.54
16.49
11.00
11.22
10.94
15.14
19.96
22.50
27.38
18.48
14.17
17.51
12.60
11.59
17.79
16.00
25.11
26.45
29.07
22.09
16.50
18.65
13.74
15.46
18.15
18.15
30.88
33.32
34.88
28.07
18.78
19.09
14.21
16.17
19.20
24.46
41.25
43.70
43.70
31.26
26.92
21.32
31.72
22.65
20.33
18.66
11.53
13.48
7.84
7.10
11.49
15.17
15.75
12.64
12.20
8.65
10.69
10.63
11.75
10.44
13.98
11.43
11.12
9.32
20.79
11.14
13.80
20.94
14.42
15.86
11.55
5.50
8.70
5.22
5.25
7.00
12.10
10.50
8.08
9.81
7.00
7.80
6.50
7.88
7.76
9.88
9.71
7.00
7.00
26.37
23.50
19.76
22.49
16.15
16.88
14.42
7.00
9.75
5.70
5.40
8.25
12.50
13.61
10.00
10.66
8.25
8.25
8.99
11.27
9.15
11.29
10.71
8.80
7.00
30.93
26.00
23.58
29.58
21.77
18.74
17.13
9.37
10.75
7.30
5.93
10.76
12.61
17.13
12.59
11.80
8.50
9.66
10.39
12.63
10.08
12.60
10.71
11.44
8.00
35.61
27.04
25.11
34.27
26.73
24.94
23.72
13.41
13.35
10.00
7.50
13.69
18.72
17.95
14.97
13.39
8.50
14.77
12.86
13.77
12.35
14.48
12.00
12.47
11.45
41.25
41.43
25.11
47.26
34.93
27.43
26.33
22.29
20.99
10.00
9.80
16.54
18.72
18.38
16.54
15.17
9.77
14.77
13.21
14.17
13.14
21.64
12.55
15.42
12.63
See footnotes at end of table.
4
Table A-1. Hourly earnings1 for selected occupations, all workers2, all industries,
Buffalo-Niagara Falls, NY, July 1998 — Continued
All industries
Percentiles
Occupation3
Mean
10
25
Median
50
75
90
$8.67
9.19
$6.94
5.75
$7.22
7.50
$7.96
8.80
$10.01
11.00
$10.98
13.75
Blue-collar occupations .....................................................
Precision production, craft, and repair occupations ..........
Supervisors, mechanics and repairers .................
Automobile mechanics .........................................
Industrial machinery repairers ..............................
Mechanics and repairers, N.E.C. ..........................
Supervisors, production occupations ....................
Machine operators, assemblers, and inspectors ..............
Molding and casting machine operators ...............
Laundering and dry cleaning machine operators
Packaging and filling machine operators ..............
Miscellaneous machine operators, N.E.C. ...........
Welders and cutters ..............................................
Assemblers ...........................................................
Production inspectors, checkers and examiners ..
Transportation and material moving occupations .............
Truck drivers .........................................................
Bus drivers ............................................................
Industrial truck and tractor equipment operators ..
Miscellaneous material moving equipment
operators, N.E.C. ............................................
Handlers, equipment cleaners, helpers, and laborers ......
Production helpers ................................................
Stock handlers and baggers .................................
Freight, stock, and material handlers, N.E.C. .......
Vehicle washers and equipment cleaners ............
Hand packers and packagers ...............................
Laborers except construction, N.E.C. ...................
14.54
18.76
24.60
16.84
19.38
17.55
21.44
13.71
10.52
6.92
10.81
12.16
16.31
13.58
12.21
13.85
12.61
11.87
15.40
7.00
12.75
19.24
13.96
14.73
13.01
16.62
6.61
7.25
5.50
7.63
8.00
10.30
5.54
6.00
8.50
8.57
7.25
11.90
9.64
15.22
21.50
14.05
16.97
14.53
17.85
8.85
8.25
6.50
8.39
9.75
13.47
7.45
6.45
10.10
9.64
8.94
13.90
14.25
18.03
23.44
15.77
17.79
16.15
19.71
13.71
8.25
6.75
10.23
12.01
15.65
13.71
9.41
14.01
12.31
10.20
14.31
19.02
22.16
27.69
16.90
24.36
21.17
24.23
19.71
11.63
7.00
13.55
14.69
21.01
20.63
16.79
16.14
14.45
16.07
15.45
21.36
25.17
31.25
22.32
24.37
25.05
28.70
21.01
18.31
8.32
13.88
17.33
21.01
20.79
20.63
19.21
18.49
16.26
20.79
15.16
9.87
9.74
8.53
13.55
6.94
8.97
10.45
13.06
5.88
6.50
5.40
8.39
3.75
6.50
6.50
13.06
6.92
6.75
5.80
9.71
5.75
7.50
7.00
14.45
8.41
7.25
6.70
13.24
6.00
7.50
10.80
18.49
12.01
11.85
8.83
18.82
9.82
8.31
12.40
18.49
16.15
16.15
15.03
19.02
9.89
13.83
14.62
Service occupations ...........................................................
Protective service occupations .................................
Guards and police except public service ..............
Food service occupations .........................................
Waiters and waitresses ........................................
Cooks ...................................................................
Kitchen workers, food preparation ........................
Food preparation occupations, N.E.C. .................
10.51
19.00
12.82
5.99
3.89
8.86
6.08
6.48
5.40
11.79
7.66
2.90
2.90
6.50
5.15
5.15
6.68
16.94
8.06
3.51
2.90
7.50
5.35
5.20
8.80
18.52
11.37
5.50
2.90
9.55
6.25
5.85
13.40
21.41
18.00
7.85
2.90
9.63
6.70
7.93
18.52
24.81
19.78
9.55
8.50
10.50
6.80
8.32
White-collar occupations (-Continued)
Administrative support occupations, including clerical
(-Continued)
Teachers’ aides ....................................................
Administrative support occupations, N.E.C. .........
See footnotes at end of table.
5
Table A-1. Hourly earnings1 for selected occupations, all workers2, all industries,
Buffalo-Niagara Falls, NY, July 1998 — Continued
All industries
Percentiles
Occupation3
Mean
Service occupations (-Continued)
Health service occupations .......................................
Health aides, except nursing ................................
Nursing aides, orderlies and attendants ...............
Cleaning and building service occupations ..............
Maids and housemen ...........................................
Janitors and cleaners ...........................................
Personal service occupations ...................................
Welfare service aides ...........................................
1 Earnings are the straight-time hourly wages or salaries paid
to employees. They include incentive pay, cost-of-living
adjustments, and hazard pay. Excluded are premium pay for
overtime, vacations, holidays, nonproduction bonuses, and tips.
The mean is computed by totaling the pay of all workers and
dividing by the number of workers, weighted by hours. The 10th,
25th, 50th, 75th and 90th percentiles designate position in the
earnings distribution. At the 50th percentile, the median, half of
the workers receive the same as or more than the rate shown,
and half receive the same as or less than the rate shown. At the
25th percentile, one-fourth of the workers earn the same as or
less than the rate shown. At the 75th percentile, one-fourth earn
the same as or more than the rate shown. The 10th and 90th
percentiles follow the same logic.
2 All workers include full-time and part-time workers.
Employees are classified as working either a full-time or a
part-time schedule based on the definition used by each
establishment. Therefore, a worker with a 35-hour-per-week
schedule might be considered a full-time employee in one
$8.83
10.16
8.66
9.84
7.63
10.06
9.72
7.73
10
25
Median
50
75
90
$6.30
6.60
6.11
5.90
5.46
6.21
5.75
6.13
$6.76
7.10
6.68
8.15
5.50
8.17
6.85
6.75
$7.96
10.58
7.95
9.33
8.32
9.58
8.82
7.51
$10.02
12.71
9.46
11.44
8.90
11.70
13.40
8.82
$13.01
14.41
12.60
13.78
9.67
14.45
14.29
9.08
establishment, but classified as part-time in another firm, where a
40-hour week is the minimum full-time schedule.
3 A classification system including about 480 individual
occupations is used to cover all workers in the civilian economy.
Individual occupations are classified into one of nine major
occupational groups.
NOTE: Dashes indicate that no data were reported or that data
did not meet publication criteria. Overall occupational groups and
occupational levels may include data for categories not shown
separately. N.E.C. means "not elsewhere classified."
NOTE: Individual and average wage rates were collected in this
update survey. A procedure was put into place to "move" the
positional statistics where averages were collected.
This
procedure compares current locality survey data–at the quote
level–with the same quote from the prior survey. Individual rates
from the prior survey are moved by the average change in mean
wages for the occupation.
6
Table A-2. Hourly earnings1 for selected occupations, all workers2, private industry and State and local government,
Buffalo-Niagara Falls, NY, July 1998
Private industry
Percentiles
Occupation3
Mean
10
All occupations ..................................................... $14.44
All occupations excluding sales .......................... 14.70
White-collar occupations .................................
White-collar occupations excluding sales .......
Professional specialty and technical
occupations ..............................................
Professional specialty occupations .............
Engineers, architects, and surveyors .....
Electrical and electronic engineers .....
Industrial engineers ............................
Engineers, N.E.C. ...............................
Mathematical and computer scientists ...
Natural scientists ....................................
Health related occupations .....................
Registered nurses ..............................
Pharmacists ........................................
Teachers, college and university ............
Teachers, except college and university
Elementary school teachers ...............
Secondary school teachers ................
Librarians, archivists, and curators .........
Social scientists and urban planners ......
Social, recreation, and religious workers
Social workers ....................................
Lawyers and judges ................................
Writers, authors, entertainers, athletes,
and professionals, N.E.C. .................
Technical occupations ................................
Clinical laboratory technologists and
technicians ....................................
Licensed practical nurses ...................
Health technologists and technicians,
N.E.C. ...........................................
Electrical and electronic technicians ...
Drafters ...............................................
Executive, administrative, and managerial
occupations ..............................................
Executives, administrators, and
managers ..........................................
Financial managers ............................
Managers, marketing, advertising and
public relations ..............................
Administrators, education and related
fields .............................................
Managers, service organizations,
N.E.C. ...........................................
Managers and administrators, N.E.C.
Management related occupations ..........
Accountants and auditors ...................
Management related occupations,
N.E.C. ...........................................
Sales occupations ..........................................
Supervisors, sales occupations ..........
Sales workers, other commodities ......
Cashiers .............................................
Administrative support occupations, including
clerical ......................................................
Supervisors, financial records
processing ....................................
Secretaries .........................................
Typists ................................................
Receptionists ......................................
Information clerks, N.E.C. ...................
Order clerks ........................................
State and local government
$6.50
6.70
25
Median
50
$8.39 $12.50
8.54 13.06
Percentiles
Mean
75
90
$19.24
19.61
$24.36
24.38
10
25
Median
50
75
90
$20.19 $10.63 $13.01 $16.30 $23.44 $36.44
20.22 10.52 13.01 16.30 23.52 36.68
15.97
16.84
7.00
7.53
9.15
9.74
13.00
14.21
20.62
21.06
27.89
28.75
23.40
23.51
11.44
11.36
13.69
13.58
19.04
19.04
29.19
29.47
42.70
42.98
19.91
22.14
27.48
25.63
22.12
30.85
24.14
–
20.53
18.86
27.04
30.45
17.93
–
–
–
–
12.75
12.33
–
11.23
12.64
17.39
21.30
15.71
19.02
19.49
–
14.08
15.44
25.19
19.04
11.23
–
–
–
–
7.24
7.24
–
14.35
17.18
22.83
24.76
17.07
26.78
20.67
–
17.54
17.48
25.76
26.09
13.04
–
–
–
–
8.77
8.16
–
18.65
20.77
26.91
25.70
21.21
30.44
23.94
–
19.84
19.20
26.76
30.24
16.90
–
–
–
–
12.34
12.34
–
23.94
26.76
31.25
26.55
27.56
35.84
28.73
–
21.82
20.82
27.97
34.70
22.08
–
–
–
–
15.64
15.50
–
30.12
31.24
36.20
29.21
28.88
44.32
30.03
–
26.76
21.54
30.16
39.04
25.56
–
–
–
–
19.73
19.73
–
30.16
31.66
–
–
–
–
–
–
22.85
18.67
–
49.65
34.28
37.07
32.73
–
–
19.15
19.30
–
14.50
17.05
–
–
–
–
–
–
17.05
16.64
–
28.75
19.34
22.16
20.61
–
–
14.87
14.87
–
19.30
20.78
–
–
–
–
–
–
17.93
17.05
–
31.71
25.17
28.40
24.90
–
–
15.51
14.87
–
26.60
28.07
–
–
–
–
–
–
19.41
18.91
–
40.64
32.68
37.99
31.47
–
–
18.29
17.13
–
38.33
39.81
–
–
–
–
–
–
22.02
19.62
–
67.40
43.83
45.91
41.39
–
–
24.33
24.33
–
49.27
50.80
–
–
–
–
–
–
38.86
21.93
–
80.93
51.38
52.60
45.55
–
–
24.33
24.33
–
19.45
14.38
12.05
10.32
15.38
11.36
17.91
14.21
21.63
17.01
25.00
18.65
–
15.22
–
11.98
–
12.94
–
14.17
–
16.17
–
21.59
17.55
12.13
14.68
9.71
16.87
10.42
17.54
12.20
18.65
13.86
19.09
14.21
–
–
–
–
–
–
–
–
–
–
–
–
12.43
15.69
17.61
10.41
10.22
15.14
11.22
10.94
15.14
11.36
17.79
16.00
14.00
18.15
18.15
16.06
19.37
24.46
–
–
–
–
–
–
–
–
–
–
–
–
–
–
–
–
–
–
28.27
16.15
20.94
25.19
32.51
42.84
22.94
14.93
17.44
23.72
26.73
30.60
30.27
35.67
19.91
22.50
22.50
27.38
26.45
29.07
33.32
34.88
45.67
43.70
26.08
–
12.58
–
23.50
–
26.00
–
28.34
–
36.10
–
31.26
20.79
26.37
30.93
35.61
41.25
–
–
–
–
–
–
–
–
–
–
–
–
29.47
23.50
25.92
26.00
34.95
41.43
21.32
31.79
23.91
20.44
13.80
20.94
13.26
15.86
19.76
22.49
16.88
16.88
23.58
29.13
22.89
18.78
25.11
34.27
28.39
25.76
25.11
47.26
34.93
27.43
–
–
20.02
–
–
–
14.93
–
–
–
14.93
–
–
–
18.80
–
–
–
23.72
–
–
–
26.73
–
18.96
11.25
13.48
7.84
6.50
11.55
5.50
8.70
5.22
5.25
11.55
6.85
9.75
5.70
5.40
14.42
9.15
10.75
7.30
5.90
26.33
12.25
13.35
10.00
7.00
30.15
22.29
20.99
10.00
8.86
–
–
–
–
–
–
–
–
–
–
–
–
–
–
–
–
–
–
–
–
–
–
–
–
–
–
–
–
–
–
10.90
7.00
8.00
9.87
12.61
16.38
13.43
8.00
11.29
13.00
15.27
16.73
15.17
11.71
–
8.65
10.25
10.63
12.10
8.00
–
7.00
7.64
6.50
12.50
8.95
–
8.25
8.25
8.99
12.61
11.13
–
8.50
9.07
10.39
18.72
13.30
–
8.50
11.78
12.86
18.72
16.12
–
9.77
14.77
13.21
–
14.85
12.78
–
–
–
–
12.38
10.91
–
–
–
–
13.17
11.80
–
–
–
–
15.27
12.48
–
–
–
–
16.05
14.01
–
–
–
–
18.04
15.17
–
–
–
See footnotes at end of table.
7
Table A-2. Hourly earnings1 for selected occupations, all workers2, private industry and State and local government,
Buffalo-Niagara Falls, NY, July 1998 — Continued
Private industry
Percentiles
Occupation3
Mean
Service occupations .........................................
Protective service occupations ...............
Guards and police except public
service ..........................................
Food service occupations .......................
Waiters and waitresses ......................
Cooks .................................................
Kitchen workers, food preparation ......
Food preparation occupations, N.E.C.
Health service occupations .....................
Health aides, except nursing ..............
Nursing aides, orderlies and
attendants .....................................
Percentiles
Mean
10
25
Median
50
75
90
$7.75
$8.67
$9.85
$11.49
$13.18
9.04
9.71
7.00
7.00
–
11.00
10.71
7.50
7.00
–
12.44
10.71
9.28
7.00
–
21.64
12.00
13.66
8.00
–
22.72
12.55
16.33
14.48
–
5.70
7.25
8.80
10.25
13.75
–
–
–
–
–
–
14.50
7.00
9.20
14.05
19.61
21.36
14.89
10.97
12.99
15.22
16.26
18.35
19.17
19.38
20.15
21.44
13.00
14.73
15.36
16.62
15.71
16.97
17.33
17.85
19.24
17.79
19.20
19.71
24.00
24.36
25.05
24.23
25.63
24.37
25.05
28.70
15.93
–
–
–
12.11
–
–
–
13.96
–
–
–
15.70
–
–
–
17.13
–
–
–
18.73
–
–
–
13.69
6.60
8.76
13.71
19.71
21.01
–
–
–
–
–
–
10.52
7.25
8.25
8.25
11.63
18.31
–
–
–
–
–
–
6.92
5.50
6.50
6.75
7.00
8.32
–
–
–
–
–
–
10.81
7.63
8.39
10.23
13.55
13.88
–
–
–
–
–
–
11.93
16.31
13.58
8.00
10.30
5.54
9.69
13.47
7.45
12.01
15.65
13.71
14.53
21.01
20.63
17.17
21.01
20.79
–
–
–
–
–
–
–
–
–
–
–
–
–
–
–
–
–
–
12.21
6.00
6.45
9.41
16.79
20.63
–
–
–
–
–
–
13.38
12.45
–
8.00
8.00
–
9.51
9.35
–
13.18
11.37
–
16.09
15.90
–
18.49
18.49
–
15.20
–
14.48
12.01
–
8.31
13.71
–
13.45
15.36
–
16.07
16.17
–
16.17
20.66
–
16.26
15.40
11.90
13.90
14.31
15.45
20.79
–
–
–
–
–
–
15.16
13.06
13.06
14.21
18.49
18.49
–
–
–
–
–
–
9.66
9.74
8.53
5.93
6.50
5.40
6.75
6.75
5.80
8.00
7.25
6.70
11.34
11.85
8.83
16.15
16.15
15.03
11.75
–
–
11.06
–
–
12.39
–
–
12.99
–
–
16.84
–
–
13.55
8.39
9.71
13.24
18.82
19.02
–
–
–
–
–
6.94
8.97
9.58
3.75
6.50
6.50
5.75
7.50
7.00
6.00
7.50
10.19
9.82
8.31
11.16
9.89
13.83
14.27
–
–
12.17
–
–
6.92
–
–
10.74
–
–
12.22
–
–
14.51
–
–
16.84
7.59
12.25
5.15
7.66
6.00
7.66
7.37
8.60
8.88
18.00
10.27
20.00
15.46
19.73
8.92
16.54
11.44
17.22
14.29
19.18
18.77
23.18
23.18
25.22
11.19
5.95
3.89
8.86
6.08
6.36
7.71
9.45
7.20
2.90
2.90
6.50
5.15
5.15
6.00
6.60
7.66
2.90
2.90
7.50
5.35
5.20
6.60
7.03
8.60
5.50
2.90
9.55
6.25
5.65
7.47
8.14
16.00
7.74
2.90
9.63
6.70
7.89
8.61
11.26
18.00
9.55
8.50
10.50
6.80
8.32
9.57
14.41
–
–
–
–
–
–
13.08
–
–
–
–
–
–
–
10.45
–
–
–
–
–
–
–
11.56
–
–
–
–
–
–
–
12.60
–
–
–
–
–
–
–
13.75
–
–
–
–
–
–
–
16.93
–
7.49
5.82
6.59
7.39
8.61
9.18
13.11
10.39
11.56
12.48
13.75
16.97
White-collar occupations (-Continued)
Administrative support occupations, including
clerical (-Continued)
Records clerks, N.E.C. ....................... $10.15
Bookkeepers, accounting and auditing
clerks ............................................ 14.61
Traffic, shipping and receiving clerks
11.43
General office clerks ........................... 10.63
Data entry keyers ...............................
8.42
Teachers’ aides ..................................
–
Administrative support occupations,
N.E.C. ...........................................
9.12
Blue-collar occupations ...................................
Precision production, craft, and repair
occupations ..............................................
Industrial machinery repairers ............
Mechanics and repairers, N.E.C. ........
Supervisors, production occupations ..
Machine operators, assemblers, and
inspectors .................................................
Molding and casting machine
operators ......................................
Laundering and dry cleaning machine
operators ......................................
Packaging and filling machine
operators ......................................
Miscellaneous machine operators,
N.E.C. ...........................................
Welders and cutters ............................
Assemblers .........................................
Production inspectors, checkers and
examiners .....................................
Transportation and material moving
occupations ..............................................
Truck drivers .......................................
Bus drivers ..........................................
Industrial truck and tractor equipment
operators ......................................
Miscellaneous material moving
equipment operators, N.E.C. ........
Handlers, equipment cleaners, helpers, and
laborers .....................................................
Production helpers ..............................
Stock handlers and baggers ...............
Freight, stock, and material handlers,
N.E.C. ...........................................
Vehicle washers and equipment
cleaners ........................................
Hand packers and packagers .............
Laborers except construction, N.E.C.
State and local government
See footnotes at end of table.
8
–
10
25
Median
50
75
90
–
–
–
–
–
$12.73 $11.29 $11.55 $13.01 $13.35 $13.95
–
–
–
–
–
–
11.49
7.35 10.88 12.21 12.41 14.32
–
–
–
–
–
–
8.97
6.94
7.39
8.54 10.35 11.11
5.57
–
–
–
Table A-2. Hourly earnings1 for selected occupations, all workers2, private industry and State and local government,
Buffalo-Niagara Falls, NY, July 1998 — Continued
Private industry
Percentiles
Occupation3
Mean
Service occupations (-Continued)
Cleaning and building service
occupations ......................................
Maids and housemen .........................
Janitors and cleaners .........................
Personal service occupations .................
Welfare service aides .........................
State and local government
$9.06
7.41
9.17
7.92
7.73
Percentiles
Mean
10
25
Median
50
75
90
$5.53
5.46
6.06
5.70
6.13
$7.37
5.50
7.50
6.32
6.75
$8.86
8.32
8.80
7.38
7.51
$10.27
8.90
10.42
8.89
8.82
$13.78
9.20
12.14
11.56
9.08
1 Earnings are the straight-time hourly wages or salaries paid to employees. They
include incentive pay, cost-of-living adjustments, and hazard pay. Excluded are premium
pay for overtime, vacations, holidays, nonproduction bonuses, and tips. The mean is
computed by totaling the pay of all workers and dividing by the number of workers,
weighted by hours. The 10th, 25th, 50th, 75th and 90th percentiles designate position in
the earnings distribution. At the 50th percentile, the median, half of the workers receive
the same as or more than the rate shown, and half receive the same as or less than the
rate shown. At the 25th percentile, one-fourth of the workers earn the same as or less
than the rate shown. At the 75th percentile, one-fourth earn the same as or more than
the rate shown. The 10th and 90th percentiles follow the same logic.
2 All workers include full-time and part-time workers. Employees are classified as
working either a full-time or a part-time schedule based on the definition used by each
establishment. Therefore, a worker with a 35-hour-per-week schedule might be
considered a full-time employee in one establishment, but classified as part-time in
another firm, where a 40-hour week is the minimum full-time schedule.
3 A classification system including about 480 individual occupations is used to cover
10
$11.09
–
11.13
11.41
–
$8.17
–
8.17
6.18
–
25
Median
50
75
90
$9.31 $11.32 $12.51 $14.52
–
–
–
–
9.31 11.44 12.56 14.52
8.21 11.57 14.29 14.29
–
–
–
–
all workers in the civilian economy. Individual occupations are classified into one of nine
major occupational groups.
NOTE: Dashes indicate that no data were reported or that data did not meet publication
criteria. Overall occupational groups and occupational levels may include data for
categories not shown separately. N.E.C. means not elsewhere classified. IN THIS SURVEY, THE NONRESPONSE RATE FOR PRIVATE INDUSTRY EXCEEDED REGULAR
SURVEY STANDARDS FOR PUBLICATION. ACCORDINGLY, USERS SHOULD INTERPRET THESE RESULTS WITH THIS LIMITATION IN MIND.
NOTE: Individual and average wage rates were collected in this update survey. A
procedure was put into place to "move" the positional statistics where averages were
collected. This procedure compares current locality survey data–at the quote level–with
the same quote from the prior survey. Individual rates from the prior survey are moved by
the average change in mean wages for the occupation.
9
Table A-3. Hourly earnings1 for selected occupations, full-time and part-time workers2, all industries, Buffalo-Niagara Falls, NY,
July 1998
All industries
Full-time
Occupation3
Percentiles
Mean
10
All occupations ..................................................... $16.85
All occupations excluding sales .......................... 17.01
White-collar occupations .................................
White-collar occupations excluding sales .......
Professional specialty and technical
occupations ..............................................
Professional specialty occupations .............
Engineers, architects, and surveyors .....
Electrical and electronic engineers .....
Industrial engineers ............................
Engineers, N.E.C. ...............................
Mathematical and computer scientists ...
Computer systems analysts and
scientists .......................................
Natural scientists ....................................
Health related occupations .....................
Registered nurses ..............................
Pharmacists ........................................
Teachers, college and university ............
Teachers, except college and university
Elementary school teachers ...............
Secondary school teachers ................
Librarians, archivists, and curators .........
Librarians ............................................
Social scientists and urban planners ......
Social, recreation, and religious workers
Social workers ....................................
Lawyers and judges ................................
Writers, authors, entertainers, athletes,
and professionals, N.E.C. .................
Technical occupations ................................
Clinical laboratory technologists and
technicians ....................................
Licensed practical nurses ...................
Health technologists and technicians,
N.E.C. ...........................................
Electrical and electronic technicians ...
Drafters ...............................................
Executive, administrative, and managerial
occupations ..............................................
Executives, administrators, and
managers ..........................................
Financial managers ............................
Managers, marketing, advertising and
public relations ..............................
Administrators, education and related
fields .............................................
Managers, service organizations,
N.E.C. ...........................................
Managers and administrators, N.E.C.
Management related occupations ..........
Accountants and auditors ...................
Management related occupations,
N.E.C. ...........................................
Sales occupations ..........................................
Supervisors, sales occupations ..........
Sales workers, other commodities ......
Cashiers .............................................
Administrative support occupations, including
clerical ......................................................
Supervisors, financial records
processing ....................................
Part-time
25
Median
50
$7.82 $10.29 $14.72
7.91 10.49 14.92
Percentiles
Mean
75
90
$20.79
20.79
$27.38
27.56
10
25
Median
50
$8.74
9.04
$5.30
5.35
$6.10
6.45
$7.25
7.25
75
90
$9.83 $14.50
10.30 15.29
19.17
19.73
8.45
8.50
11.07
11.55
16.06
16.46
23.84
24.75
33.53
34.42
10.16
11.45
5.50
6.50
6.75
7.25
8.03
9.60
12.50
14.01
17.79
18.67
24.66
27.17
27.21
25.63
22.12
30.85
23.65
12.12
15.30
18.44
21.30
15.71
19.02
20.67
16.17
19.02
22.83
24.76
17.07
26.78
21.44
21.48
24.10
26.78
25.70
21.21
30.44
23.17
29.77
32.11
31.25
26.55
27.56
35.84
24.90
41.11
43.83
35.84
29.21
28.88
44.32
29.66
16.86
18.43
–
–
–
–
–
10.41
13.17
–
–
–
–
–
13.17
15.75
–
–
–
–
–
16.75
18.00
–
–
–
–
–
19.31
20.00
–
–
–
–
–
20.62
21.76
–
–
–
–
–
23.11
–
21.59
18.97
26.54
44.93
33.69
33.42
31.55
21.63
21.63
–
15.13
14.88
–
20.15
–
15.02
15.62
20.78
23.24
18.39
15.70
18.76
14.04
14.04
–
7.60
7.24
–
21.35
–
18.06
17.35
25.60
29.87
24.33
22.91
23.86
14.04
14.04
–
10.78
9.43
–
22.07
–
20.35
19.08
26.76
36.22
32.11
32.82
30.34
19.50
19.50
–
14.87
14.87
–
24.06
–
24.61
20.82
27.36
66.36
42.98
43.26
40.70
22.94
22.94
–
19.73
19.73
–
28.85
–
29.48
21.91
30.16
80.93
50.95
52.41
45.22
46.81
46.81
–
22.97
24.33
–
–
–
19.51
18.41
–
24.37
11.12
–
–
–
–
–
–
–
–
–
–
15.91
15.92
–
15.75
5.15
–
–
–
–
–
–
–
–
–
–
17.01
17.01
–
23.50
5.50
–
–
–
–
–
–
–
–
–
–
18.43
18.43
–
26.00
13.17
–
–
–
–
–
–
–
–
–
–
20.33
20.11
–
26.00
13.75
–
–
–
–
–
–
–
–
–
–
21.41
20.94
–
26.00
14.50
–
–
–
–
–
–
–
–
20.12
14.76
12.05
10.90
16.85
11.61
18.95
14.21
22.09
17.14
28.07
19.09
–
12.85
–
10.20
–
10.41
–
13.00
–
14.00
–
16.90
18.07
12.34
16.49
9.79
17.29
11.00
18.65
12.59
18.65
13.86
19.09
14.21
–
12.07
–
9.71
–
10.98
–
13.00
–
13.22
–
13.27
13.19
15.69
17.61
11.22
10.22
15.14
11.22
10.94
15.14
11.75
17.79
16.00
16.06
18.15
18.15
16.17
19.37
24.46
–
–
–
–
–
–
–
–
–
–
–
–
–
–
–
–
–
–
27.33
14.93
20.50
25.19
30.90
41.25
–
–
–
–
–
–
29.77
35.67
19.76
22.50
22.62
27.38
26.87
29.07
33.32
34.88
43.70
43.70
–
–
–
–
–
–
–
–
–
–
–
–
31.26
20.79
26.37
30.93
35.61
41.25
–
–
–
–
–
–
27.42
11.14
24.44
26.00
27.04
41.43
–
–
–
–
–
–
21.32
31.72
22.95
20.33
13.80
20.94
14.49
15.86
19.76
22.49
16.88
16.88
23.58
29.58
22.50
18.74
25.11
34.27
26.73
24.94
25.11
47.26
34.93
27.43
–
–
–
–
–
–
–
–
–
–
–
–
–
–
–
–
–
–
–
–
–
–
–
–
19.60
13.73
13.48
8.57
8.97
11.55
7.00
8.70
5.15
5.90
14.93
8.86
9.75
6.45
6.50
17.13
10.75
10.75
9.05
8.00
24.35
17.26
13.35
10.00
9.80
26.92
22.88
20.99
10.00
14.71
–
6.96
–
6.91
5.84
–
5.25
–
5.40
5.20
–
5.50
–
5.50
5.35
–
6.15
–
6.29
5.60
–
7.62
–
8.00
6.00
–
9.53
–
9.21
7.00
12.03
7.45
8.80
11.50
14.17
17.25
8.53
6.45
7.00
7.59
9.58
12.00
15.17
12.10
12.50
12.61
18.72
18.72
–
–
–
–
–
See footnotes at end of table.
10
–
Table A-3. Hourly earnings1 for selected occupations, full-time and part-time workers2, all industries, Buffalo-Niagara Falls, NY,
July 1998 — Continued
All industries
Full-time
Occupation3
Percentiles
Mean
10
25
Median
50
White-collar occupations (-Continued)
Administrative support occupations, including
clerical (-Continued)
Computer operators ............................ $15.75 $10.50 $13.61 $17.13
Secretaries ......................................... 12.69
8.08 10.00 12.59
Typists ................................................ 12.11
9.81 10.66 11.80
Receptionists ......................................
9.03
8.25
8.50
8.50
Information clerks, N.E.C. ................... 10.83
8.00
8.30
9.85
Order clerks ........................................ 10.63
6.50
8.99 10.39
Library clerks ...................................... 12.06
8.30 11.27 12.63
Records clerks, N.E.C. ....................... 10.79
8.20
9.15 10.53
Bookkeepers, accounting and auditing
clerks ............................................ 14.12
9.88 11.29 13.01
Traffic, shipping and receiving clerks
11.50
9.71 10.71 10.71
Stock and inventory clerks .................. 11.50
5.60
6.35
9.28
General office clerks ........................... 11.92
8.59 10.29 12.02
Data entry keyers ...............................
9.62
7.00
7.00
8.90
Administrative support occupations,
N.E.C. ........................................... 10.12
7.59
8.00
9.44
Blue-collar occupations ...................................
Precision production, craft, and repair
occupations ..............................................
Supervisors, mechanics and repairers
Automobile mechanics .......................
Industrial machinery repairers ............
Mechanics and repairers, N.E.C. ........
Supervisors, production occupations ..
Machine operators, assemblers, and
inspectors .................................................
Packaging and filling machine
operators ......................................
Miscellaneous machine operators,
N.E.C. ...........................................
Welders and cutters ............................
Assemblers .........................................
Production inspectors, checkers and
examiners .....................................
Transportation and material moving
occupations ..............................................
Truck drivers .......................................
Bus drivers ..........................................
Industrial truck and tractor equipment
operators ......................................
Miscellaneous material moving
equipment operators, N.E.C. ........
Handlers, equipment cleaners, helpers, and
laborers .....................................................
Production helpers ..............................
Stock handlers and baggers ...............
Freight, stock, and material handlers,
N.E.C. ...........................................
Hand packers and packagers .............
Laborers except construction, N.E.C.
Service occupations .........................................
Protective service occupations ...............
Food service occupations .......................
Waiters and waitresses ......................
Food preparation occupations, N.E.C.
Health service occupations .....................
Health aides, except nursing ..............
Part-time
Percentiles
Mean
10
25
Median
50
75
90
75
90
$17.95
15.23
13.19
8.50
14.77
12.86
13.77
12.91
$18.38
16.71
15.17
9.77
14.77
13.21
14.17
13.18
–
$10.65
–
–
–
–
–
–
–
$8.00
–
–
–
–
–
–
14.48
12.55
16.30
12.99
11.47
22.72
12.55
20.91
16.06
12.95
–
–
–
7.77
–
–
–
–
5.15
–
–
–
–
6.25
–
–
–
–
7.25
–
–
–
–
8.82
–
–
–
–
10.50
–
12.50
13.75
7.65
5.40
5.75
7.20
8.95
11.00
13.37
–
–
–
–
$9.00 $11.94 $11.94 $11.94
–
–
–
–
–
–
–
–
–
–
–
–
–
–
–
–
–
–
–
–
–
–
–
–
15.11
7.50
10.59
14.73
19.61
21.47
8.19
5.50
6.00
7.21
9.45
18.84
24.60
16.84
19.38
17.55
21.44
13.00
19.24
13.96
14.73
13.01
16.62
15.25
21.50
14.05
16.97
14.53
17.85
18.15
23.44
15.77
17.79
16.15
19.71
22.16
27.69
16.90
24.36
21.17
24.23
25.17
31.25
22.32
24.37
25.05
28.70
–
–
–
–
–
–
–
–
–
–
–
–
–
–
–
–
–
–
–
–
–
–
–
–
–
–
–
–
–
–
–
–
–
–
–
–
14.10
7.06
9.56
13.88
20.63
21.01
6.46
5.50
6.00
6.25
7.00
7.50
10.81
7.63
8.39
10.23
13.55
13.88
–
–
–
–
–
–
12.22
16.31
14.32
8.00
10.30
6.00
9.75
13.47
8.59
12.01
15.65
14.82
14.69
21.01
20.79
17.33
21.01
20.79
–
–
–
–
–
–
–
–
–
–
–
–
–
–
–
–
–
–
12.21
6.00
6.45
9.41
16.79
20.63
–
–
–
–
–
–
14.58
12.52
–
9.00
8.50
–
11.75
9.35
–
14.31
11.78
–
16.26
15.90
–
20.79
18.49
–
10.25
–
9.52
7.25
–
7.25
7.71
–
7.71
9.00
–
8.95
12.76
–
11.05
14.45
–
14.82
15.45
11.90
14.31
14.31
17.45
20.79
–
–
–
–
–
–
15.21
13.06
13.06
14.21
18.49
18.49
–
–
–
–
–
–
10.46
9.74
10.83
6.41
6.50
5.85
7.25
6.75
6.65
8.85
7.25
8.75
12.82
11.85
14.97
16.84
16.15
20.63
7.18
–
–
5.25
–
–
5.60
–
–
6.35
–
–
7.62
–
–
9.82
–
–
14.75
8.97
10.72
9.71
6.59
6.50
11.68
7.50
7.25
13.61
7.50
10.80
18.83
8.31
12.44
20.79
13.83
14.62
10.19
–
–
7.00
–
–
7.02
–
–
9.47
–
–
10.43
–
–
18.81
–
–
12.07
19.42
7.34
–
6.71
9.76
11.25
5.93
15.70
5.15
–
5.20
5.82
7.67
8.15
17.14
5.30
–
5.30
7.63
8.64
10.41
18.82
7.50
–
6.00
8.88
11.26
15.59
23.18
9.50
–
8.32
11.59
13.75
21.00
25.08
10.25
–
8.32
13.75
14.41
6.72
12.67
4.83
3.46
5.82
7.43
–
2.90
6.40
2.90
2.90
5.15
6.35
–
5.50
7.28
2.90
2.90
5.15
6.60
–
6.66
11.79
5.15
2.90
5.15
6.96
–
7.65
18.00
6.24
2.90
6.38
7.65
–
9.20
20.00
6.98
5.06
7.23
9.06
–
See footnotes at end of table.
11
Table A-3. Hourly earnings1 for selected occupations, full-time and part-time workers2, all industries, Buffalo-Niagara Falls, NY,
July 1998 — Continued
All industries
Full-time
Occupation3
Percentiles
Mean
Service occupations (-Continued)
Health service occupations (-Continued)
Nursing aides, orderlies and
attendants .....................................
Cleaning and building service
occupations ......................................
Janitors and cleaners .........................
Personal service occupations .................
Welfare service aides .........................
Part-time
Percentiles
Mean
10
25
Median
50
75
90
$9.55
$5.75
$7.50
$8.72
$11.56
$13.40
10.12
10.42
10.61
–
6.21
7.00
5.93
–
8.29
8.29
7.54
–
9.65
10.41
10.46
–
11.87
12.03
14.29
–
14.25
14.52
14.29
–
1 Earnings are the straight-time hourly wages or salaries paid to employees. They
include incentive pay, cost-of-living adjustments, and hazard pay. Excluded are premium
pay for overtime, vacations, holidays, nonproduction bonuses, and tips. The mean is
computed by totaling the pay of all workers and dividing by the number of workers,
weighted by hours. The 10th, 25th, 50th, 75th and 90th percentiles designate position in
the earnings distribution. At the 50th percentile, the median, half of the workers receive
the same as or more than the rate shown, and half receive the same as or less than the
rate shown. At the 25th percentile, one-fourth of the workers earn the same as or less
than the rate shown. At the 75th percentile, one-fourth earn the same as or more than
the rate shown. The 10th and 90th percentiles follow the same logic.
2 Employees are classified as working either a full-time or a part-time schedule based
on the definition used by each establishment.
Therefore, a worker with a
35-hour-per-week schedule might be considered a full-time employee in one
establishment, but classified as part-time in another firm, where a 40-hour week is the
10
25
Median
50
75
90
$7.37
$6.30
$6.66
$6.96
$7.65
$9.06
7.76
7.39
7.13
7.44
5.90
5.90
5.55
6.10
5.90
5.90
6.00
6.40
7.37
6.50
6.75
6.95
9.33
9.20
8.81
8.89
10.12
9.33
9.08
9.08
minimum full-time schedule.
3 A classification system including about 480 individual occupations is used to cover
all workers in the civilian economy. Individual occupations are classified into one of nine
major occupational groups.
NOTE: Dashes indicate that no data were reported or that data did not meet publication
criteria. Overall occupational groups and occupational levels may include data for
categories not shown separately. N.E.C. means "not elsewhere classified."
NOTE: Individual and average wage rates were collected in this update survey. A
procedure was put into place to "move" the positional statistics where averages were
collected. This procedure compares current locality survey data–at the quote level–with
the same quote from the prior survey. Individual rates from the prior survey are moved by
the average change in mean wages for the occupation.
12
Table A-4. Weekly and annual earnings1 and hours for selected occupations, full-time workers only2, all industries,
Buffalo-Niagara Falls, NY, July 1998
All industries
Occupation3
Mean
weekly
hours4
Weekly earnings
Mean
Median
Mean
annual
hours
Annual earnings
Mean
Median
All occupations .......................................................................
All occupations excluding sales ............................................
39.1
39.1
$660
665
$572
579
1,985
1,982
$33,453
33,716
$29,765
30,098
White-collar occupations ...................................................
White-collar occupations excluding sales .........................
38.7
38.6
742
761
607
642
1,931
1,920
37,015
37,877
31,346
32,989
Professional specialty and technical occupations ............
Professional specialty occupations ...............................
Engineers, architects, and surveyors .......................
Electrical and electronic engineers .......................
Industrial engineers ..............................................
Engineers, N.E.C. .................................................
Mathematical and computer scientists .....................
Computer systems analysts and scientists ...........
Natural scientists ......................................................
Health related occupations .......................................
Registered nurses ................................................
Pharmacists ..........................................................
Teachers, college and university ..............................
Teachers, except college and university ..................
Elementary school teachers .................................
Secondary school teachers ..................................
Librarians, archivists, and curators ...........................
Librarians ..............................................................
Social scientists and urban planners ........................
Social, recreation, and religious workers ..................
Social workers ......................................................
Lawyers and judges ..................................................
Writers, authors, entertainers, athletes, and
professionals, N.E.C. ..........................................
Technical occupations ..................................................
Clinical laboratory technologists and technicians
Licensed practical nurses .....................................
Health technologists and technicians, N.E.C. .......
Electrical and electronic technicians .....................
Drafters .................................................................
Executive, administrative, and managerial occupations ...
Executives, administrators, and managers ...............
Financial managers ..............................................
Managers, marketing, advertising and public
relations ..........................................................
Administrators, education and related fields .........
Managers, service organizations, N.E.C. .............
Managers and administrators, N.E.C. ..................
Management related occupations ............................
Accountants and auditors .....................................
Management related occupations, N.E.C. ............
Sales occupations ............................................................
Supervisors, sales occupations ............................
Sales workers, other commodities ........................
Cashiers ...............................................................
Administrative support occupations, including clerical .....
Supervisors, financial records processing ............
Computer operators ..............................................
Secretaries ...........................................................
Typists ..................................................................
Receptionists ........................................................
Information clerks, N.E.C. .....................................
Order clerks ..........................................................
Library clerks ........................................................
Records clerks, N.E.C. .........................................
Bookkeepers, accounting and auditing clerks ......
Traffic, shipping and receiving clerks ...................
Stock and inventory clerks ....................................
General office clerks .............................................
Data entry keyers .................................................
Administrative support occupations, N.E.C. .........
37.8
37.7
40.3
41.0
40.3
40.3
39.6
39.5
–
38.2
38.0
39.1
36.6
35.3
35.7
37.0
35.5
35.5
–
37.9
38.4
–
933
1,024
1,097
1,050
891
1,243
937
914
–
824
721
1,039
1,644
1,189
1,195
1,168
768
768
–
573
571
–
827
923
1,071
1,032
848
1,227
926
868
–
776
745
1,070
1,313
1,140
1,140
1,119
683
683
–
594
595
–
1,787
1,740
2,097
2,131
2,096
2,095
2,060
2,056
–
1,960
1,968
2,035
1,336
1,398
1,373
1,478
1,723
1,723
–
1,971
1,997
–
44,059
47,295
57,046
54,621
46,350
64,639
48,729
47,518
–
42,313
37,322
54,024
60,033
47,081
45,873
46,625
37,271
37,271
–
29,810
29,699
–
40,539
44,281
55,706
53,643
44,117
63,794
48,131
45,157
–
40,369
38,688
55,661
48,911
45,305
45,588
44,776
30,990
30,990
–
30,888
30,921
–
39.1
38.4
37.7
38.4
37.7
40.0
40.0
40.2
40.7
41.3
787
567
682
473
497
628
704
1,100
1,211
1,475
716
533
699
488
449
712
640
1,016
1,125
1,163
2,035
1,997
1,963
1,995
1,959
2,080
2,080
2,090
2,116
2,150
40,930
29,467
35,463
24,611
25,844
32,632
36,627
57,136
62,986
76,693
37,253
27,710
36,368
25,354
23,338
37,003
33,280
52,832
58,474
60,468
41.3
39.7
37.7
42.0
39.4
39.4
38.8
39.7
40.0
37.2
39.7
38.7
40.0
38.8
37.5
37.8
39.6
38.4
40.0
37.8
39.7
38.3
39.0
39.4
38.9
39.6
39.3
1,290
1,089
803
1,333
905
801
760
545
539
319
356
466
607
611
476
457
358
416
425
455
429
541
449
453
464
381
398
1,269
1,040
904
1,260
871
759
685
430
430
319
320
447
504
685
500
443
340
394
416
505
419
470
411
379
458
356
352
2,145
2,066
1,959
2,186
2,046
2,049
2,016
2,043
2,080
1,934
2,022
2,005
2,080
2,017
1,952
1,963
2,060
1,997
2,080
1,880
2,067
1,992
2,030
2,049
2,024
2,061
2,001
67,059
56,650
41,773
69,325
46,967
41,648
39,504
28,050
28,043
16,578
18,133
24,124
31,546
31,758
24,765
23,786
18,602
21,620
22,118
22,661
22,308
28,127
23,343
23,559
24,120
19,825
20,257
65,978
54,080
47,006
65,494
45,282
39,460
35,630
22,360
22,360
16,598
16,640
23,088
26,230
35,630
26,021
23,010
17,680
20,493
21,611
26,270
21,777
24,442
21,382
19,698
23,816
18,512
18,304
See footnotes at end of table.
13
Table A-4. Weekly and annual earnings1 and hours for selected occupations, full-time workers only2, all industries,
Buffalo-Niagara Falls, NY, July 1998 — Continued
All industries
Occupation3
Mean
weekly
hours4
Weekly earnings
Mean
Median
Mean
annual
hours
Annual earnings
Mean
Median
Blue-collar occupations .....................................................
Precision production, craft, and repair occupations ..........
Supervisors, mechanics and repairers .................
Automobile mechanics .........................................
Industrial machinery repairers ..............................
Mechanics and repairers, N.E.C. ..........................
Supervisors, production occupations ....................
Machine operators, assemblers, and inspectors ..............
Packaging and filling machine operators ..............
Miscellaneous machine operators, N.E.C. ...........
Welders and cutters ..............................................
Assemblers ...........................................................
Production inspectors, checkers and examiners ..
Transportation and material moving occupations .............
Truck drivers .........................................................
Industrial truck and tractor equipment operators ..
Miscellaneous material moving equipment
operators, N.E.C. ............................................
Handlers, equipment cleaners, helpers, and laborers ......
Production helpers ................................................
Stock handlers and baggers .................................
Freight, stock, and material handlers, N.E.C. .......
Hand packers and packagers ...............................
Laborers except construction, N.E.C. ...................
39.8
39.9
40.0
40.0
40.0
39.8
40.0
39.8
40.0
39.8
40.0
40.0
39.7
39.8
40.0
40.0
$602
752
984
673
775
698
858
561
432
487
653
573
484
580
501
618
$589
726
938
631
712
646
788
552
409
450
626
593
376
572
471
572
2,068
2,076
2,080
2,080
2,080
2,069
2,080
2,069
2,080
2,071
2,080
2,080
2,063
2,067
2,080
2,080
$31,243
39,114
51,161
35,020
40,303
36,322
44,598
29,174
22,485
25,314
33,931
29,795
25,194
30,131
26,037
32,144
$30,597
37,752
48,755
32,811
37,003
33,592
40,997
28,683
21,273
23,420
32,552
30,826
19,573
29,765
24,497
29,765
39.0
39.9
39.6
40.0
40.0
40.0
40.0
593
417
386
433
590
359
429
568
353
314
350
544
300
432
2,028
2,049
2,059
2,080
2,080
2,080
2,080
30,849
21,430
20,047
22,527
30,670
18,660
22,302
29,557
18,325
16,339
18,200
28,309
15,600
22,464
Service occupations ...........................................................
Protective service occupations .................................
Food service occupations .........................................
Food preparation occupations, N.E.C. .................
Health service occupations .......................................
Health aides, except nursing ................................
Nursing aides, orderlies and attendants ...............
Cleaning and building service occupations ..............
Janitors and cleaners ...........................................
Personal service occupations ...................................
39.0
41.1
37.4
36.5
38.6
37.7
38.7
39.1
39.6
37.0
470
798
275
245
377
424
370
396
412
393
391
766
263
219
344
423
344
363
391
404
1,978
2,136
1,872
1,732
2,008
1,959
2,015
2,028
2,051
1,680
23,881
41,497
13,743
11,616
19,602
22,029
19,249
20,519
21,370
17,828
19,864
39,853
12,249
11,018
17,909
22,006
17,901
18,857
20,313
17,062
1 Earnings are the straight-time wages or salaries paid to employees. They
include incentive pay, cost-of-living adjustments, and hazard pay. Excluded are
premium pay for overtime, vacations, holidays, nonproduction bonuses, and tips.
The mean is computed by totaling the pay of all workers and dividing by the
number of workers, weighted by hours.
The median designates
position--one-half of the workers receive the same as or more, and one-half
receive the same as or less than the rate shown.
2 Employees are classified as working either a full-time or a part-time
schedule based on the definition used by each establishment. Therefore, a
worker with a 35-hour-per-week schedule might be considered a full-time
employee in one establishment, but classified as part-time in another firm, where
a 40-hour week is the minimum full-time schedule.
3 A classification system including about 480 individual occupations is used
to cover all workers in the civilian economy. Individual occupations are classified
into one of nine major occupational groups.
4 Mean weekly hours are the hours an employee is scheduled to work in a
week, exclusive of overtime.
NOTE: Dashes indicate that no data were reported or that data did not meet
publication criteria. Overall occupational groups and occupational levels may
include data for categories not shown separately. N.E.C. means "not elsewhere
classified."
NOTE: Individual and average wage rates were collected in this update survey.
A procedure was put into place to "move" the positional statistics where averages
were collected. This procedure compares current locality survey data–at the
quote level–with the same quote from the prior survey. Individual rates from the
prior survey are moved by the average change in mean wages for the
occupation.
14
Table B-1. Mean hourly earnings1 by occupational group and levels2, all industries, private industry,
State and local government, full-time and part-time workers, Buffalo-Niagara Falls, NY, July 1998
All workers 4
All industries
All industries
Private
industry
State and
local
government
Full-time
workers
Part-time
workers
All occupations .......................................................................
All occupations excluding sales ............................................
$15.73
16.01
$14.44
14.70
$20.19
20.22
$16.85
17.01
$8.74
9.04
White-collar occupations ...................................................
Level 1 ..............................................................
Level 2 ..............................................................
Level 3 ..............................................................
Level 4 ..............................................................
Level 5 ..............................................................
Level 6 ..............................................................
Level 7 ..............................................................
Level 8 ..............................................................
Level 9 ..............................................................
Level 10 ............................................................
Level 11 ............................................................
Level 12 ............................................................
Level 13 ............................................................
Level 14 ............................................................
Not able to be leveled .......................................
White-collar occupations excluding sales .........................
Level 1 ..............................................................
Level 2 ..............................................................
Level 3 ..............................................................
Level 4 ..............................................................
Level 5 ..............................................................
Level 6 ..............................................................
Level 7 ..............................................................
Level 8 ..............................................................
Level 9 ..............................................................
Level 10 ............................................................
Level 11 ............................................................
Level 12 ............................................................
Level 13 ............................................................
Level 14 ............................................................
Not able to be leveled .......................................
17.96
6.95
8.00
9.30
11.79
13.10
14.44
17.99
26.66
23.33
26.30
28.24
33.79
46.27
55.24
29.18
18.83
7.44
8.15
9.56
12.46
12.95
14.28
17.94
26.74
23.32
26.94
28.40
33.79
46.27
55.24
31.77
15.97
6.42
7.61
9.18
11.38
12.87
14.35
17.64
19.09
22.95
25.26
27.66
34.79
38.60
–
37.84
16.84
6.79
7.74
9.45
12.11
12.69
14.09
17.56
18.78
22.93
25.49
27.80
34.79
38.60
–
48.08
23.40
9.72
9.83
10.28
13.64
13.81
14.66
19.18
35.55
23.91
–
29.72
31.86
–
–
–
23.51
9.72
9.83
10.28
13.64
13.70
14.66
19.18
35.55
23.91
–
29.72
31.86
–
–
–
19.17
7.51
8.13
9.54
11.95
13.24
14.43
18.08
27.64
23.44
26.42
28.16
33.79
46.27
55.24
31.79
19.73
7.65
8.23
9.70
12.52
13.07
14.26
18.02
27.77
23.43
27.09
28.30
33.79
46.27
55.24
–
10.16
6.59
7.64
8.69
10.25
11.49
–
16.92
18.10
19.44
–
–
–
–
–
21.41
11.45
–
7.93
9.01
11.68
11.71
–
16.92
18.10
19.44
–
–
–
–
–
21.41
Professional specialty and technical occupations ............
Professional specialty occupations ...............................
Level 5 ..............................................................
Level 6 ..............................................................
Level 7 ..............................................................
Level 8 ..............................................................
Level 9 ..............................................................
Level 10 ............................................................
Level 11 ............................................................
Level 12 ............................................................
Level 13 ............................................................
Level 14 ............................................................
Engineers, architects, and surveyors .......................
Level 9 ..............................................................
Level 11 ............................................................
Level 12 ............................................................
Mathematical and computer scientists .....................
Natural scientists ......................................................
Health related occupations .......................................
Level 7 ..............................................................
Level 8 ..............................................................
Level 9 ..............................................................
Teachers, college and university ..............................
Level 11 ............................................................
Level 13 ............................................................
Teachers, except college and university ..................
Level 8 ..............................................................
Level 9 ..............................................................
Librarians, archivists, and curators ...........................
23.96
26.47
12.22
14.58
19.27
29.59
23.06
26.56
29.47
34.45
50.76
52.16
27.21
24.45
30.73
31.52
23.44
–
21.16
18.70
19.20
21.11
44.11
29.71
55.44
32.53
38.89
27.52
21.63
19.91
22.14
11.56
14.78
19.59
18.51
22.32
24.04
28.96
32.34
–
–
27.48
25.32
30.73
–
24.14
–
20.53
18.80
18.37
22.31
30.45
–
–
17.93
–
–
–
30.16
31.66
–
–
–
37.17
23.68
–
30.25
–
–
–
–
–
–
–
–
–
22.85
–
–
19.77
49.65
–
–
34.28
38.89
–
–
24.66
27.17
12.46
14.66
19.52
31.31
23.22
26.73
29.30
34.45
50.76
52.16
27.21
24.45
30.73
31.52
23.65
–
21.59
18.68
19.95
21.28
44.93
29.71
55.44
33.69
38.89
27.52
21.63
16.86
18.43
–
–
17.92
18.12
–
–
–
–
–
–
–
–
–
–
–
–
19.51
18.75
–
–
24.37
–
–
11.12
–
–
–
Occupational group3 and level
See footnotes at end of table.
15
Table B-1. Mean hourly earnings1 by occupational group and levels2, all industries, private industry,
State and local government, full-time and part-time workers, Buffalo-Niagara Falls, NY, July 1998 —
Continued
All workers 4
Occupational group3 and level
White-collar occupations (-Continued)
Social scientists and urban planners ........................
Social, religious, and recreation workers ..................
Lawyers and judges ..................................................
Writers, authors, entertainers, athletes, and
professionals, N.E.C. ..........................................
Technical occupations ..................................................
Level 4 ..............................................................
Level 5 ..............................................................
Level 6 ..............................................................
Level 7 ..............................................................
Level 8 ..............................................................
Executive, administrative, and managerial occupations ...
Level 7 ..............................................................
Level 8 ..............................................................
Level 9 ..............................................................
Level 10 ............................................................
Level 11 ............................................................
Level 12 ............................................................
Executives, administrators, and managers ...............
Level 7 ..............................................................
Level 9 ..............................................................
Level 11 ............................................................
Level 12 ............................................................
Management related occupations ............................
Level 7 ..............................................................
Level 8 ..............................................................
Level 9 ..............................................................
Sales occupations ............................................................
Level 1 ..............................................................
Level 2 ..............................................................
Level 3 ..............................................................
Level 4 ..............................................................
Level 5 ..............................................................
Administrative support occupations, including clerical .....
Level 1 ..............................................................
Level 2 ..............................................................
Level 3 ..............................................................
Level 4 ..............................................................
Level 5 ..............................................................
Level 6 ..............................................................
Level 7 ..............................................................
Blue-collar occupations .........................................................
Level 1 ..............................................................
Level 2 ..............................................................
Level 3 ..............................................................
Level 4 ..............................................................
Level 5 ..............................................................
Level 6 ..............................................................
Level 7 ..............................................................
Level 8 ..............................................................
Level 9 ..............................................................
Precision production, craft, and repair occupations ..........
Level 4 ..............................................................
Level 5 ..............................................................
Level 6 ..............................................................
Level 7 ..............................................................
Level 8 ..............................................................
Level 9 ..............................................................
Machine operators, assemblers, and inspectors ..............
Level 1 ..............................................................
Level 2 ..............................................................
Level 4 ..............................................................
See footnotes at end of table.
16
All industries
All industries
Private
industry
State and
local
government
Full-time
workers
Part-time
workers
–
$15.12
–
–
$12.75
–
–
$19.15
–
–
$15.13
–
–
–
–
19.92
14.53
11.29
12.75
13.75
15.93
18.11
27.06
15.93
21.16
24.24
28.66
27.72
33.41
29.55
17.45
24.55
28.31
34.57
22.65
15.07
20.08
23.68
11.53
5.72
6.62
8.18
9.32
13.93
11.49
7.44
8.15
9.55
12.61
13.20
14.43
19.06
19.45
14.38
11.29
12.50
13.76
16.07
18.44
28.27
15.88
21.57
24.04
28.66
26.87
36.09
30.27
–
23.99
27.38
36.39
23.91
14.93
–
24.17
11.25
5.72
6.62
8.18
9.32
13.76
10.90
6.79
7.74
9.44
12.25
13.05
13.73
16.29
–
15.22
–
–
–
–
–
22.94
–
–
–
–
–
–
26.08
–
–
–
–
20.02
–
–
–
–
–
–
–
–
–
13.43
9.72
9.83
10.28
13.64
13.60
15.56
–
20.12
14.76
11.15
12.95
13.58
15.98
18.17
27.33
16.09
21.26
24.24
28.66
27.72
33.41
29.77
17.45
24.55
28.31
34.57
22.95
15.25
20.08
23.68
13.73
–
–
8.03
9.60
14.12
12.03
7.65
8.23
9.70
12.69
13.25
14.43
19.06
–
$12.85
–
12.05
–
–
–
–
–
–
–
–
–
–
–
–
–
–
–
–
–
–
–
6.96
5.67
–
8.26
–
–
8.53
–
7.93
8.90
11.53
–
–
–
14.54
6.66
8.88
15.27
14.18
14.50
15.48
19.40
21.45
25.56
18.76
14.12
13.09
15.74
19.73
21.50
25.56
13.71
6.40
8.45
16.37
14.50
6.68
8.53
15.43
14.18
14.45
15.56
19.74
21.32
25.56
19.17
14.12
13.04
15.94
20.20
–
25.56
13.69
6.40
8.45
16.34
14.89
–
–
–
14.19
14.65
–
16.64
–
–
15.93
–
–
–
16.64
–
–
–
–
–
–
15.11
6.85
9.10
15.41
14.82
14.53
15.48
19.40
21.45
25.56
18.84
14.12
13.09
15.74
19.74
21.50
25.56
14.10
6.44
8.67
16.37
8.19
6.19
7.46
11.44
10.27
–
–
–
–
–
–
–
–
–
–
–
–
6.46
–
–
–
Table B-1. Mean hourly earnings1 by occupational group and levels2, all industries, private industry,
State and local government, full-time and part-time workers, Buffalo-Niagara Falls, NY, July 1998 —
Continued
All workers 4
All industries
All industries
Private
industry
State and
local
government
Full-time
workers
Part-time
workers
Blue-collar occupations (-Continued)
Machine operators, assemblers, and inspectors
(-Continued)
Level 5 ..............................................................
Level 6 ..............................................................
Level 7 ..............................................................
Transportation and material moving occupations .............
Level 3 ..............................................................
Level 4 ..............................................................
Level 5 ..............................................................
Handlers, equipment cleaners, helpers, and laborers .....
Level 1 ..............................................................
Level 2 ..............................................................
Level 3 ..............................................................
Level 4 ..............................................................
$14.16
14.84
16.71
13.85
11.42
12.45
15.33
9.87
6.77
9.30
13.83
11.29
$14.16
14.84
16.71
13.38
11.25
12.40
15.63
9.66
6.82
8.69
14.06
10.44
–
–
–
$15.20
–
–
14.96
11.75
–
–
–
–
$14.16
14.84
16.71
14.58
11.31
13.57
15.43
10.46
7.05
9.40
14.11
11.29
–
–
–
$10.25
–
10.27
–
7.18
6.21
8.46
10.95
–
Service occupations ...........................................................
Level 1 ..............................................................
Level 2 ..............................................................
Level 3 ..............................................................
Level 4 ..............................................................
Level 5 ..............................................................
Level 6 ..............................................................
Level 7 ..............................................................
Protective service occupations ...............................
Level 7 ..............................................................
Food service occupations ........................................
Level 1 ..............................................................
Level 2 ..............................................................
Level 3 ..............................................................
Health service occupations .....................................
Level 2 ..............................................................
Level 3 ..............................................................
Level 4 ..............................................................
Cleaning and building service occupations ............
Level 1 ..............................................................
Level 2 ..............................................................
Level 3 ..............................................................
Level 5 ..............................................................
Personal service occupations .................................
Level 1 ..............................................................
Level 2 ..............................................................
Level 4 ..............................................................
10.51
7.03
7.93
8.44
10.53
13.16
15.23
20.98
19.00
21.15
5.99
5.99
5.01
5.28
8.83
8.25
8.89
9.82
9.84
8.76
8.52
10.36
12.25
9.72
6.24
10.02
11.27
7.59
6.35
6.87
7.77
9.23
–
–
–
12.25
–
5.95
5.88
5.01
5.28
7.71
7.27
8.18
–
9.06
7.32
7.72
–
–
7.92
–
–
9.23
15.46
9.06
11.81
11.59
13.33
13.21
–
21.15
19.73
21.15
–
–
–
–
13.08
–
–
–
11.09
10.26
–
–
–
11.41
–
–
–
12.07
7.48
9.09
9.21
10.73
13.10
15.23
20.98
19.42
21.15
7.34
6.05
–
–
9.76
9.48
8.98
–
10.12
9.43
8.57
10.38
12.25
10.61
–
10.54
11.56
6.72
6.62
6.43
6.60
9.22
–
–
–
12.67
–
4.83
5.94
4.23
3.89
7.43
7.13
–
–
7.76
7.49
–
–
–
7.13
6.45
–
–
Occupational group3 and level
1 Earnings are the straight-time hourly wages or salaries paid to
employees. They include incentive pay, cost-of-living adjustments,
and hazard pay. Excluded are premium pay for overtime, vacations,
holidays, nonproduction bonuses, and tips. The mean is computed
by totaling the pay of all workers and dividing by the number of
workers, weighted by hours.
2 Each occupation for which wage data are collected in an
establishment is evaluated based on 10 factors, including knowledge,
complexity, work environment, etc. Points are assigned based on the
occupation’s ranking within each factor. The points are summed to
determine the overall level of the occupation. See technical note for
more information.
3 A classification system including about 480 individual
occupations is used to cover all workers in the civilian economy.
Individual occupations are classified into one of nine major
occupational groups.
4 All workers include full-time and part-time workers. Employees
are classified as working either a full-time or a part-time schedule
based on the definition used by each establishment. Therefore, a
worker with a 35-hour-per-week schedule might be considered a
full-time employee in one establishment, but classified as part-time in
another firm, where a 40-hour week is the minimum full-time
schedule.
NOTE: Dashes indicate that no data were reported or that data did
not meet publication criteria. Overall occupational groups and
occupational levels may include data for categories not shown
separately. N.E.C. means not elsewhere classified. IN THIS SURVEY, THE NONRESPONSE RATE FOR PRIVATE INDUSTRY EXCEEDED REGULAR SURVEY STANDARDS FOR PUBLICATION.
ACCORDINGLY, USERS SHOULD INTERPRET THESE RESULTS
WITH THIS LIMITATION IN MIND.
NOTE: Individual and average wage rates were collected in this
update survey. A procedure was put into place to "move" the
positional statistics where averages were collected. This procedure
compares current locality survey data–at the quote level–with the
same quote from the prior survey. Individual rates from the prior
survey are moved by the average change in mean wages for the
occupation.
17
Table B-2. Mean hourly earnings1 for selected occupations and levels2, all industries, private
industry, State and local government, full-time and part-time workers, Buffalo-Niagara Falls, NY, July
1998
All workers4
Occupation3 and level
White-collar occupations:
Professional specialty and technical occupations:
Professional specialty occupations:
Electrical and electronic engineers .......................
Industrial engineers ..............................................
Engineers, N.E.C. .................................................
Computer systems analysts and scientists ...........
Registered nurses ................................................
Level 7 ..............................................................
Level 8 ..............................................................
Level 9 ..............................................................
Pharmacists ..........................................................
Teachers, post secondary N.E.C. .........................
Elementary school teachers .................................
Level 8 ..............................................................
Secondary school teachers ..................................
Level 8 ..............................................................
Librarians ..............................................................
Social workers ......................................................
Technical occupations:
Clinical laboratory technologists and technicians
Licensed practical nurses .....................................
Level 5 ..............................................................
Health technologists and technicians, N.E.C. .......
Electrical and electronic technicians .....................
Drafters .................................................................
Executive, administrative, and managerial occupations:
Financial managers ..............................................
Managers, marketing, advertising and public
relations ..........................................................
Level 9 ..............................................................
Administrators, education and related fields .........
Managers, service organizations, N.E.C. .............
Managers and administrators, N.E.C. ..................
Level 11 ............................................................
Level 12 ............................................................
Accountants and auditors .....................................
Management related occupations, N.E.C. ............
Sales occupations:
Supervisors, sales occupations ............................
Level 4 ..............................................................
Sales workers, other commodities ........................
Level 4 ..............................................................
Cashiers ...............................................................
Level 1 ..............................................................
Level 3 ..............................................................
Administrative support occupations, including clerical:
Supervisors, financial records processing ............
Computer operators ..............................................
Secretaries ...........................................................
Level 4 ..............................................................
Level 5 ..............................................................
Typists ..................................................................
Receptionists ........................................................
Information clerks, N.E.C. .....................................
Order clerks ..........................................................
Library clerks ........................................................
Records clerks, N.E.C. .........................................
Bookkeepers, accounting and auditing clerks ......
Level 4 ..............................................................
Level 5 ..............................................................
Traffic, shipping and receiving clerks ...................
Stock and inventory clerks ....................................
General office clerks .............................................
Level 2 ..............................................................
See footnotes at end of table.
18
All industries
All industries
Private
industry
State and
local
government
Full-time
workers
Part-time
workers
$25.63
22.12
30.85
22.89
18.81
18.70
18.24
18.92
26.54
33.49
33.42
38.66
31.55
37.34
21.63
14.87
$25.63
22.12
30.85
–
18.86
18.80
18.41
18.69
27.04
–
–
–
–
–
–
12.33
–
–
–
–
$18.67
–
–
19.07
–
–
37.07
38.66
32.73
37.34
–
19.30
$25.63
22.12
30.85
23.11
18.97
18.68
18.39
18.82
26.54
–
33.42
38.66
31.55
37.34
21.63
14.88
–
–
–
–
$18.41
18.75
–
–
–
–
–
–
–
–
–
–
17.18
12.30
11.99
12.98
15.61
17.61
17.55
12.13
11.99
12.43
15.69
17.61
–
–
–
–
–
–
18.07
12.34
12.16
13.19
15.69
17.61
–
12.07
–
–
–
–
35.67
35.67
–
35.67
–
31.26
27.42
26.92
21.32
31.72
25.82
35.02
20.33
18.66
31.26
27.42
–
21.32
31.79
25.82
35.02
20.44
18.96
31.26
27.42
27.42
21.32
31.72
25.82
35.02
20.33
19.60
–
–
–
–
–
–
–
–
–
13.48
9.43
7.84
8.26
7.10
5.68
7.44
13.48
9.43
7.84
8.26
6.50
5.68
7.44
13.48
9.43
8.57
–
8.97
–
–
–
–
6.91
–
5.84
5.62
–
15.17
15.75
12.64
13.08
12.37
12.20
8.65
10.69
10.63
11.75
10.44
13.98
13.51
16.46
11.43
–
11.12
8.98
15.17
–
11.71
11.29
–
–
8.65
10.25
10.63
–
10.15
14.61
13.94
–
11.43
–
10.63
–
15.17
15.75
12.69
13.16
12.41
12.11
9.03
10.83
10.63
12.06
10.79
14.12
13.51
16.46
11.50
11.50
11.92
–
–
–
10.65
–
–
–
–
–
–
–
–
–
–
–
–
–
7.77
8.01
–
–
29.47
–
–
–
–
–
–
–
–
–
–
–
–
–
–
–
14.85
–
–
12.78
–
–
–
–
–
12.73
–
–
–
–
11.49
–
Table B-2. Mean hourly earnings1 for selected occupations and levels2, all industries, private
industry, State and local government, full-time and part-time workers, Buffalo-Niagara Falls, NY, July
1998 — Continued
All workers4
Occupation3 and level
White-collar occupations: (-Continued)
Administrative support occupations, including clerical:
(-Continued)
General office clerks (-Continued)
Level 4 ..............................................................
Data entry keyers .................................................
Level 2 ..............................................................
Teachers’ aides ....................................................
Administrative support occupations, N.E.C. .........
Level 3 ..............................................................
Level 4 ..............................................................
Blue-collar occupations:
Precision production, craft, and repair occupations:
Supervisors, mechanics and repairers .................
Automobile mechanics .........................................
Industrial machinery repairers ..............................
Level 7 ..............................................................
Mechanics and repairers, N.E.C. ..........................
Level 7 ..............................................................
Supervisors, production occupations ....................
Level 7 ..............................................................
Machine operators, assemblers, and inspectors:
Molding and casting machine operators ...............
Laundering and dry cleaning machine operators
Packaging and filling machine operators ..............
Miscellaneous machine operators, N.E.C. ...........
Level 5 ..............................................................
Welders and cutters ..............................................
Assemblers ...........................................................
Production inspectors, checkers and examiners ..
Transportation and material moving occupations:
Truck drivers .........................................................
Level 3 ..............................................................
Level 4 ..............................................................
Level 5 ..............................................................
Bus drivers ............................................................
Level 4 ..............................................................
Industrial truck and tractor equipment operators ..
Level 5 ..............................................................
Miscellaneous material moving equipment
operators, N.E.C. ............................................
Handlers, equipment cleaners, helpers, and laborers:
Production helpers ................................................
Stock handlers and baggers .................................
Level 3 ..............................................................
Freight, stock, and material handlers, N.E.C. .......
Level 3 ..............................................................
Vehicle washers and equipment cleaners ............
Hand packers and packagers ...............................
Laborers except construction, N.E.C. ...................
Service occupations:
Protective service occupations:
Guards and police except public service ..............
Food service occupations:
Waiters and waitresses ........................................
Level 3 ..............................................................
Cooks ...................................................................
Kitchen workers, food preparation ........................
Food preparation occupations, N.E.C. .................
Level 1 ..............................................................
Health service occupations:
Health aides, except nursing ................................
Nursing aides, orderlies and attendants ...............
See footnotes at end of table.
19
All industries
State and
local
government
All industries
Private
industry
$12.47
9.32
7.41
8.67
9.19
8.63
11.45
–
$8.42
7.41
–
9.12
–
11.45
24.60
16.84
19.38
21.30
17.55
18.63
21.44
18.63
–
–
19.38
21.30
20.15
–
21.44
18.63
–
–
–
–
–
–
–
–
24.60
16.84
19.38
21.30
17.55
18.63
21.44
18.63
–
–
–
–
–
–
–
–
10.52
6.92
10.81
12.16
14.38
16.31
13.58
12.21
10.52
6.92
10.81
11.93
14.38
16.31
13.58
12.21
–
–
–
–
–
–
–
–
–
–
10.81
12.22
14.38
16.31
14.32
12.21
–
–
–
–
–
–
–
–
12.61
9.35
12.30
15.19
11.87
–
15.40
14.57
12.45
–
12.30
–
–
–
15.40
14.57
12.52
9.35
–
15.26
–
–
15.45
14.57
–
–
–
–
9.52
9.32
–
–
15.16
15.16
15.21
–
9.74
8.53
14.65
13.55
14.49
6.94
8.97
10.45
9.74
8.53
14.65
13.55
14.49
6.94
8.97
9.58
12.82
11.19
–
–
–
3.89
4.35
8.86
6.08
6.48
5.98
3.89
4.35
8.86
6.08
6.36
5.74
–
–
–
–
–
–
–
–
–
–
6.71
–
3.46
–
–
–
5.82
–
10.16
8.66
9.45
7.49
11.25
9.55
–
7.37
–
–
–
$8.97
–
–
–
–
–
–
–
14.48
–
–
–
–
–
–
–
–
–
–
–
12.17
–
13.11
Full-time
workers
Part-time
workers
$12.47
9.62
–
–
10.12
–
–
–
–
–
–
$7.65
–
–
9.74
10.83
–
14.75
15.16
–
8.97
10.72
–
–
–
10.19
–
–
–
–
Table B-2. Mean hourly earnings1 for selected occupations and levels2, all industries, private
industry, State and local government, full-time and part-time workers, Buffalo-Niagara Falls, NY, July
1998 — Continued
All workers4
Occupation3 and level
Service occupations: (-Continued)
Health service occupations: (-Continued)
Nursing aides, orderlies and attendants
(-Continued)
Level 2 ..............................................................
Level 3 ..............................................................
Cleaning and building service occupations:
Maids and housemen ...........................................
Janitors and cleaners ...........................................
Level 1 ..............................................................
Level 2 ..............................................................
Level 3 ..............................................................
Level 5 ..............................................................
Personal service occupations:
Welfare service aides ...........................................
1 Earnings are the straight-time hourly wages or salaries paid to
employees. They include incentive pay, cost-of-living adjustments,
and hazard pay. Excluded are premium pay for overtime, vacations,
holidays, nonproduction bonuses, and tips. The mean is computed
by totaling the pay of all workers and dividing by the number of
workers, weighted by hours.
2 Each occupation for which wage data are collected in an
establishment is evaluated based on 10 factors, including knowledge,
complexity, work environment, etc. Points are assigned based on the
occupation’s ranking within each factor. The points are summed to
determine the overall level of the occupation. See technical note for
more information.
3 A classification system including about 480 individual
occupations is used to cover all workers in the civilian economy.
Individual occupations are classified into one of nine major
occupational groups.
4 All workers include full-time and part-time workers. Employees
are classified as working either a full-time or a part-time schedule
based on the definition used by each establishment. Therefore, a
worker with a 35-hour-per-week schedule might be considered a
All industries
Private
industry
$8.29
8.10
$7.28
8.10
7.63
10.06
9.15
8.82
10.56
11.90
7.73
All industries
State and
local
government
Full-time
workers
Part-time
workers
–
–
$9.48
–
$7.14
–
7.41
9.17
7.41
–
–
–
–
$11.13
10.26
–
–
–
–
10.42
10.29
8.92
10.56
11.90
–
7.39
–
–
–
–
7.73
–
–
7.44
full-time employee in one establishment, but classified as part-time in
another firm, where a 40-hour week is the minimum full-time
schedule.
NOTE: Dashes indicate that no data were reported or that data did
not meet publication criteria. Overall occupational groups and
occupational levels may include data for categories not shown
separately. N.E.C. means not elsewhere classified. IN THIS SURVEY, THE NONRESPONSE RATE FOR PRIVATE INDUSTRY EXCEEDED REGULAR SURVEY STANDARDS FOR PUBLICATION.
ACCORDINGLY, USERS SHOULD INTERPRET THESE RESULTS
WITH THIS LIMITATION IN MIND.
NOTE: Individual and average wage rates were collected in this
update survey. A procedure was put into place to "move" the
positional statistics where averages were collected. This procedure
compares current locality survey data–at the quote level–with the
same quote from the prior survey. Individual rates from the prior
survey are moved by the average change in mean wages for the
occupation.
20
Table C-1. Mean hourly earnings1 by occupational group and selected characteristics, all industries,
Buffalo-Niagara Falls, NY, July 1998
Occupational group2
Full-time
workers3
Part-time
workers3
Union4
Nonunion4
Time5
Incentive5
All occupations .......................................................................
All occupations excluding sales ............................................
$16.85
17.01
$8.74
9.04
$17.63
17.90
$14.13
14.33
$15.77
16.02
$14.61
15.26
White-collar occupations ...................................................
White-collar excluding sales .............................................
19.17
19.73
10.16
11.45
20.65
21.67
16.41
17.11
18.03
18.80
15.86
22.23
Professional specialty and technical occupations ............
Professional specialty occupations ...............................
Technical occupations ..................................................
Executive, administrative, and managerial occupations ...
Sales occupations ............................................................
Administrative support including clerical occupations ......
24.66
27.17
14.76
27.33
13.73
12.03
16.86
18.43
12.85
–
6.96
8.53
27.79
30.40
14.65
21.72
10.62
13.99
20.42
22.42
14.45
28.18
11.89
10.15
23.96
26.47
14.53
26.90
10.93
11.49
–
–
–
–
13.77
–
Blue-collar occupations .....................................................
Precision production, craft, and repair occupations ..........
Machine operators, assemblers, and inspectors ..............
Transportation and material moving occupations .............
Handlers, equipment cleaners, helpers, and laborers .....
15.11
18.84
14.10
14.58
10.46
8.19
–
6.46
10.25
7.18
16.29
18.96
16.65
14.15
12.27
12.20
18.41
10.01
13.38
7.91
14.57
18.78
13.72
13.66
9.94
13.48
–
–
–
–
Service occupations ...........................................................
12.07
6.72
13.44
7.36
10.53
–
1 Earnings are the straight-time hourly wages or salaries paid to
employees. They include incentive pay, cost-of-living adjustments, and
hazard pay. Excluded are premium pay for overtime, vacations, holidays,
nonproduction bonuses, and tips. The mean is computed by totaling the pay
of all workers and dividing by the number of workers, weighted by hours.
2 A classification system including about 480 individual occupations is
used to cover all workers in the civilian economy. Individual occupations are
classified into one of nine major occupational groups.
3 Employees are classified as working either a full-time or a part-time
schedule based on the definition used by each establishment. Therefore, a
worker with a 35-hour-per-week schedule might be considered a full-time
employee in one establishment, but classified as part-time in another firm,
where a 40-hour week is the minimum full-time schedule.
4 Union workers are those whose wages are determined through
collective bargaining.
5 Time workers’ wages are based solely on an hourly rate or salary;
incentive workers are those whose wages are at least partially based on
productivity payments such as piece rates, commissions, and production
bonuses.
NOTE: Dashes indicate that no data were reported or that data did not meet
publication criteria. Overall occupational groups and occupational levels may
include data for categories not shown separately. N.E.C. means "not
elsewhere classified."
NOTE: Individual and average wage rates were collected in this update
survey. A procedure was put into place to "move" the positional statistics
where averages were collected. This procedure compares current locality
survey data–at the quote level–with the same quote from the prior survey.
Individual rates from the prior survey are moved by the average change in
mean wages for the occupation.
21
Table C-2. Mean hourly earnings1 by occupational group and industry division, private industry, all workers2, Buffalo-Niagara
Falls, NY, July 1998
Goods-producing industries4
Occupational group3
All private
industries
Service-producing industries5
Total
Mining
Construction
Manufacturing
Total
TransWholeportsale
ation
and
and
retail
public
trade
utilities
Finance,
insurance,
and
real
estate
Services
All occupations ...........................................................................
All occupations excluding sales ................................................
$14.44
14.70
$17.51
17.45
–
–
–
–
$17.80
17.70
–
–
–
–
–
–
–
–
–
–
White-collar occupations .......................................................
White-collar excluding sales .................................................
15.97
16.84
22.12
22.11
–
–
–
–
22.40
22.24
–
–
–
–
–
–
–
–
–
–
Professional specialty and technical occupations ................
Professional specialty occupations ...................................
Technical occupations ......................................................
Executive, administrative, and managerial occupations .......
Sales occupations ................................................................
Administrative support, including clerical occupations .........
19.91
22.14
14.38
28.27
11.25
10.90
23.64
26.55
16.14
29.95
22.23
13.07
–
–
–
–
–
–
–
–
–
–
–
–
23.64
26.55
16.14
30.30
26.91
13.04
–
–
–
–
–
–
–
–
–
–
–
–
–
–
–
–
–
–
–
–
–
–
–
–
–
–
–
–
–
–
Blue-collar occupations .........................................................
Precision production, craft, and repair occupations ..............
Machine operators, assemblers, and inspectors ..................
Transportation and material moving occupations .................
Handlers, equipment cleaners, helpers, and laborers .........
14.50
19.17
13.69
13.38
9.66
15.62
19.08
14.91
13.60
11.93
–
–
–
–
–
–
–
–
–
–
15.83
19.85
14.91
14.18
12.38
–
–
–
–
–
–
–
–
–
–
–
–
–
–
–
–
–
–
–
–
–
–
–
–
–
Service occupations ...............................................................
7.59
11.16
–
–
11.16
–
–
–
–
–
1 Earnings are the straight-time hourly wages or salaries paid to employees. They
include incentive pay, cost-of-living adjustments, and hazard pay. Excluded are premium
pay for overtime, vacations, holidays, nonproduction bonuses, and tips. The mean is
computed by totaling the pay of all workers and dividing by the number of workers,
weighted by hours.
2 All workers include full-time and part-time workers. Employees are classified as
working either a full-time or a part-time schedule based on the definition used by each
establishment. Therefore, a worker with a 35-hour-per-week schedule might be
considered a full-time employee in one establishment, but classified as part-time in
another firm, where a 40-hour week is the minimum full-time schedule.
3 A classification system including about 480 individual occupations is used to cover
all workers in the civilian economy. Individual occupations are classified into one of nine
major occupational groups.
4 Goods-producing industries include mining, construction, and manufacturing.
5 Service-producing industries include transportation and public utilities; wholesale
and retail trade; finance, insurance, and real estate; and services.
NOTE: Dashes indicate that no data were reported or that data did not meet publication
criteria. Overall occupational groups and occupational levels may include data for
categories not shown separately. N.E.C. means not elsewhere classified. IN THIS SURVEY, THE NONRESPONSE RATE FOR PRIVATE INDUSTRY EXCEEDED REGULAR
SURVEY STANDARDS FOR PUBLICATION. ACCORDINGLY, USERS SHOULD INTERPRET THESE RESULTS WITH THIS LIMITATION IN MIND.
NOTE: Individual and average wage rates were collected in this update survey. A
procedure was put into place to "move" the positional statistics where averages were
collected. This procedure compares current locality survey data–at the quote level–with
the same quote from the prior survey. Individual rates from the prior survey are moved by
the average change in mean wages for the occupation.
22
Table C-3. Mean hourly earnings1 by occupational group and establishment employment size, private
industry, all workers2, Buffalo-Niagara Falls, NY, July 1998
100 workers or more
All private
industry
workers
50 - 99
workers
All occupations .......................................................................
All occupations excluding sales ............................................
$14.44
14.70
White-collar occupations ...................................................
White-collar excluding sales .............................................
Occupational group3
Total
100 - 499
workers
500
workers or
more
$13.19
13.20
$14.75
15.05
$12.82
13.14
$18.08
18.09
15.97
16.84
13.90
14.19
16.39
17.30
14.85
16.08
18.92
18.97
Professional specialty and technical occupations ............
Professional specialty occupations ...............................
Technical occupations ..................................................
Executive, administrative, and managerial occupations ...
Sales occupations ............................................................
Administrative support, including clerical occupations .....
19.91
22.14
14.38
28.27
11.25
10.90
14.90
18.59
11.54
25.01
13.05
10.60
20.46
22.39
15.01
28.91
10.56
10.96
21.12
22.51
14.71
27.24
9.79
10.57
19.91
22.27
15.14
30.83
17.55
11.84
Blue-collar occupations .....................................................
Precision production, craft, and repair occupations ..........
Machine operators, assemblers, and inspectors ..............
Transportation and material moving occupations .............
Handlers, equipment cleaners, helpers, and laborers .....
14.50
19.17
13.69
13.38
9.66
14.42
17.56
11.27
15.19
10.16
14.52
20.00
13.96
12.60
9.45
12.01
18.98
10.44
11.31
8.46
18.24
21.14
17.85
15.16
14.15
Service occupations ...........................................................
7.59
5.99
8.03
7.72
9.34
1 Earnings are the straight-time hourly wages or salaries paid to
employees. They include incentive pay, cost-of-living adjustments,
and hazard pay. Excluded are premium pay for overtime, vacations,
holidays, nonproduction bonuses, and tips. The mean is computed
by totaling the pay of all workers and dividing by the number of
workers, weighted by hours.
2 All workers include full-time and part-time workers. Employees
are classified as working either a full-time or a part-time schedule
based on the definition used by each establishment. Therefore, a
worker with a 35-hour-per-week schedule might be considered a
full-time employee in one establishment, but classified as part-time in
another firm, where a 40-hour week is the minimum full-time
schedule.
3 A classification system including about 480 individual
occupations is used to cover all workers in the civilian economy.
Individual occupations are classified into one of nine major
occupational groups.
NOTE: Dashes indicate that no data were reported or that data did
not meet publication criteria. Overall occupational groups and
occupational levels may include data for categories not shown
separately. N.E.C. means not elsewhere classified. IN THIS SURVEY, THE NONRESPONSE RATE FOR PRIVATE INDUSTRY EXCEEDED REGULAR SURVEY STANDARDS FOR PUBLICATION.
ACCORDINGLY, USERS SHOULD INTERPRET THESE RESULTS
WITH THIS LIMITATION IN MIND.
NOTE: Individual and average wage rates were collected in this
update survey. A procedure was put into place to "move" the
positional statistics where averages were collected. This procedure
compares current locality survey data–at the quote level–with the
same quote from the prior survey. Individual rates from the prior
survey are moved by the average change in mean wages for the
occupation.
23
Table C-4. Number of workers1 represented by occupational group, Buffalo-Niagara
Falls, NY, July 1998
All workers
Occupational group2
All industries
Private
industry
State and
local government
All occupations .......................................................................
All occupations excluding sales ............................................
303,797
283,779
231,209
211,859
72,588
71,920
White-collar occupations ...................................................
White-collar excluding sales .............................................
159,664
139,647
113,255
93,904
46,410
45,742
Professional specialty and technical occupations ............
Professional specialty occupations ...............................
Technical occupations ..................................................
Executive, administrative, and managerial occupations ...
Sales occupations ............................................................
Administrative support including clerical occupations ......
61,890
50,159
11,732
17,077
20,018
60,680
34,542
24,837
9,705
12,938
19,350
46,424
27,348
25,322
2,026
4,138
–
14,256
Blue-collar occupations .....................................................
Precision production, craft, and repair occupations ..........
Machine operators, assemblers, and inspectors ..............
Transportation and material moving occupations .............
Handlers, equipment cleaners, helpers, and laborers .....
96,591
27,093
31,022
18,781
19,695
85,886
23,659
30,839
13,754
17,634
10,705
3,435
–
–
2,061
Service occupations ...........................................................
47,541
32,069
15,472
1 Both full-time and part-time workers were included in
the survey. Employees are classified as working either a
full-time or a part-time schedule based on the definition
used by each establishment. Therefore, a worker with a
35-hour-per-week schedule might be considered a full-time
employee in one establishment, but classified as part-time
in another establishment, where a 40-hour week is the
minimum full-time schedule.
2 A classification system including about 480 individual
occupations is used to cover all workers in the civilian
economy. Individual occupations are classified into one of
nine major occupational groups.
groups and occupational levels may include data for
categories not shown separately.
N.E.C. means not
elsewhere classified. IN THIS SURVEY, THE NONRESPONSE RATE FOR PRIVATE INDUSTRY EXCEEDED
REGULAR SURVEY STANDARDS FOR PUBLICATION.
ACCORDINGLY, USERS SHOULD INTERPRET THESE
RESULTS WITH THIS LIMITATION IN MIND.
NOTE: Individual and average wage rates were collected in
this update survey. A procedure was put into place to
"move" the positional statistics where averages were
collected. This procedure compares current locality survey
data–at the quote level–with the same quote from the prior
survey. Individual rates from the prior survey are moved by
the average change in mean wages for the occupation.
NOTE: Dashes indicate that no data were reported or that
data did not meet publication criteria. Overall occupational
24
Appendix A. Technical Note
erence month for the public sector is June 1994. Due to the
volatility of industries within the private sector, sampling
frames were developed using the most recent month of
reference available at the time the sample was selected.
The reference month for the private sector is May 1995.
The sampling frame was reviewed prior to the survey and,
when necessary, missing establishments were added, outof-business and out-of-scope establishments were
removed, and addresses, employment levels, industry
classification, and other information were updated.
This section provides basic information on the
procedures and concepts used to produce the data
contained in this bulletin. It is divided into three parts:
Planning for the survey; data collection; and processing
and analyzing the data. While this section answers some
questions commonly asked by data users, it is not a
comprehensive description of all the steps required to
produce the data.
Planning for the survey
Sample design
The sample for this survey area was selected using a
two stage stratified design with probability proportional to
employment sampling at each stage. The first stage of
sample selection was a probability sample of
establishments. The sample of establishments was drawn
by first stratifying the sampling frame where the strata are
determined by industry and whether the establishment is
private, State government or local government. The
number of sample establishments allocated to each stratum
is approximately proportional to the stratum employment.
Each sampled establishment is selected within a stratum
with a probability proportional to its employment. Use of
this technique means that the larger an establishment’s
employment, the greater its chance of selection. Weights
were applied to each establishment when the data were
tabulated so that the sample units within each stratum
represent all the units within the stratum, both sampled and
nonsampled. See appendix table 1 for a count of
establishments in the survey by employment size. The
second stage of sample selection, detailed below, was a
probability sample of occupations within a sampled
establishment.
The overall design of the survey is based on the type of
data to be produced. Establishments that participate in the
NCS are studied for several collection cycles. This allows
changes in wages within these establishments to be
observed over time. Individual wage data are collected for
selected jobs during each establishment’s initial cycle and
updated during subsequent cycles. When data are not
available during a collection cycle, efforts are made to
collect the data during subsequent cycles and include it in
later tabulations. Beginning in the year 2001, the current
NCS sample will be replenished on a rotating basis.
Survey scope
This survey of the Buffalo-Niagara Falls, NY
Metropolitan Statistical Area covered establishments
employing 50 workers or more in goods-producing
industries (mining, construction and manufacturing);
service-producing
industries
(transportation,
communications, electric, gas, and sanitary services;
wholesale trade; retail trade; finance, insurance, and real
estate; and services industries); and State and local
governments. Agriculture, private households, and the
Federal Government were excluded from the scope of the
survey. For purposes of this survey an establishment was
an economic unit which produces goods or services, a
central administrative office, or an auxiliary unit providing
support services to a company. For private industries in
this survey, the establishment was usually at a single
physical location. For State and local governments, an
establishment was defined as all locations of a government
entity.
The Buffalo-Niagara Falls, NY MSA includes Erie and
Niagara Counties.
Data collection
Detailed procedures are followed when collecting data
from survey respondents. For the initial data collection,
field economists, working out of the Regional Office,
visited each establishment surveyed. The field economists
- through mail, phone, or personal visit - completed update
collection, which involved obtaining current pay data.
The following procedures are used for schedules
initiated for the first time or reinitiated during an update.
Sampling frame
The list of establishments from which the survey
sample was selected (sampling frame) was developed from
the State unemployment insurance reports for the BuffaloNiagara Falls, NY Metropolitan Statistical Area. The ref-
Occupational selection and classification
Identification of the occupations for which wage data
were to be collected was a multi-step process:
25
A complete list of all individual occupations, classified
by the MOG to which they belong, is contained in
appendix B.
In step three, certain other job characteristics of the
chosen worker were identified. First, the worker was
identified as holding either a full-time or part-time job,
based on the establishment’s definition of those terms.
Then the worker was classified as having a time versus
incentive job, depending on whether any part of pay was
directly based on the actual production of the worker,
rather than solely on hours worked. Finally, the worker
was identified as being in a union job or a nonunion job.
See the “Definition of Terms” section on the following
page for more detail.
1. Probability-proportional-to-size selection of establishment jobs.
2. Classification of jobs into occupations based on the
Census of Population system.
3. Characterization of jobs as full-time v. part-time,
union v. nonunion, and time v. incentive.
4. Determination of the level of work of each job.
For each occupation, wage data were collected for those
workers who met all the criteria identified in the last three
steps. Special procedures were developed for jobs for
which a correct classification or level could not be
determined.
In step one, the jobs to be sampled were selected at
each establishment by the BLS field economist during a
personal visit. A complete list of employees was used for
sampling, with each selected worker representing a job
within the establishment.
As with the selection of establishments, the selection of
a job was based on probability proportional to its size in
the establishment. The greater the number of people
working in a job in the establishment, the greater its chance
of selection.
The number of jobs collected in each establishment was
based on an establishment’s employment size as shown in
the following schedule:
Number of employees
50-99
100-249
250-999
1000-2,499
2,500+
Generic leveling through point factor analysis
In the last step before wage data were collected, the
work level of each selected job was determined using a
“generic leveling” process. Generic leveling ranks and
compares all occupations randomly selected in an
establishment using the same criteria. This is a major
departure from the method used in the past in the Bureau’s
Occupational Compensation Surveys which studied
specifically defined occupations with leveling definitions
unique to each occupation.
For this survey, the level of each occupation in an
establishment was determined by an analysis of each of 10
leveling factors. Nine of these factors are drawn from the
U.S. Government Office of Personnel Management’s
Factor Evaluation System, which is the underlying
structure for evaluation of General Schedule Federal
employees. The tenth factor, supervisory duties, attempts
to account for the effect of supervisory duties. It is
considered experimental. The 10 factors are:
Number of selected jobs
8
10
12
16
20
·
·
·
·
·
·
·
·
·
·
The second step of the process entailed classifying the
selected jobs into occupations based on their duties. The
National Compensation Survey occupational classification
system is based on the 1990 Census of Population. A
selected job may fall into any one of about 480
occupational classifications, from accountant to wood lathe
operator. In cases where a job’s duties overlapped two or
more Census classification codes, the duties used to set the
wage level were used to classify the job. Classification by
primary duties was the fallback.
Each occupational classification is an element of a
broader classification known as a major occupational group
(MOG). Occupations can fall into any of the following
MOG’s:
·
·
·
·
·
·
·
·
·
Knowledge
Supervision received
Guidelines
Complexity
Scope and effect
Personal contacts
Purpose of contacts
Physical demands
Work environment
Supervisory duties
Each factor contains a number of levels and each level
has an associated written description and point value. The
number and range of points differ among the factors. For
each factor, an occupation was assigned a level based on
which written description best matched the job. Within
each occupation, the points for 9 factors (supervisory
duties was excluded) were recorded and totaled. The total
determines the overall level of the occupation. Appendix
table 3 presents average work levels for published
occupational groups and selected occupations.
A
description of the levels for each factor is shown in
appendix C.
Professional specialty and technical
Executive, administrative, and managerial
Sales
Administrative support including clerical
Precision production, craft, and repair
Machine operators, assemblers, and inspectors
Transportation and material moving
Handlers, equipment cleaners, helpers, and laborers
Service occupations
26
overtime provisions, often work beyond the assigned work
schedule, their typical number of hours actually worked
was collected.
Tabulations of levels of work for occupations in the
survey follow the Federal Government’s white-collar
General Schedule. Point ranges for each of the 15 levels
are shown in appendix D. It also includes an example of a
leveled job and a guide to help data users evaluate jobs in
their firm.
Wage data collected in prior surveys using the new
generic leveling method were evaluated by BLS
researchers using regression techniques. For each of the
major occupational groups, wages were compared to the 10
generic level factors (and levels within those factors). The
analysis showed that several of the generic level factors,
most notably knowledge and supervision received, had
strong explanatory power for wages. That is, as the levels
within a given factor increased, the wages also increased.
Detailed research continues in the area. The results of this
research will be published by BLS in the future.
Definition of terms
Full-time worker. Any employee that the employer considers
to be full time.
Incentive worker. Any employee whose earnings are tied, at
least in part, to commissions, piece rates, production bonuses,
or other incentives based on production or sales.
Level. A ranking of an occupation based on the requirements
of the position. (See the description in the technical note and
the example for more details on the leveling process.)
Nonunion worker. An employee in an occupation not meeting
the conditions for union coverage (see below).
Collection period
The survey was collected from May 1998 through October
1998. The average payroll reference month was July 1998.
For each establishment in the survey, the data reflect the
establishment’s practices on the day of collection.
Part-time worker. Any employee that the employer considers
to be part-time.
Straight-time. Time worked at the standard rate of pay for the
job.
Earnings
Earnings were defined as regular payments from the
employer to the employee as compensation for straight-time
hourly work, or for any salaried work performed. The
following components were included as part of earnings:
·
·
·
·
·
Time-based worker. Any employee whose earnings are tied to
an hourly rate or salary, and not to a specific level of
production.
Union worker. Any employee is in a union occupation when
all of the following conditions are met:
Incentive pay, including commissions, production
bonuses, and piece rates
Cost-of-living allowances
Hazard pay
Payments of income deferred due to participation in a
salary reduction plan
Deadhead pay, defined as pay given to transportation
workers returning in a vehicle without freight or
passengers
·
·
·
The following forms of payments were not considered part
of straight-time earnings:
·
·
·
·
·
·
·
A labor organization is recognized as the bargaining
agent for all workers in the occupation.
Wage and salary rates are determined through collective
bargaining or negotiations.
Settlement terms, which must include earnings provisions
and may include benefit provisions, are embodied in a
signed mutually binding collective bargaining agreement.
Processing and analyzing the data
Data were processed and analyzed at the Bureau’s
National Office following collection.
Shift differentials, defined as extra payment for
working a schedule that varies from the norm, such as
night or weekend work
Premium pay for overtime, holidays, and weekends
Bonuses not directly tied to production (e.g.,
Christmas bonuses, profit-sharing bonuses)
Uniform and tool allowances
Free room and board
Payments made by third parties (e.g., tips, bonuses
given by manufacturers to department store
salespeople, referral incentives in real estate)
On-call pay
Weighting and nonresponse
Sample weights were calculated for each establishment/occupation in the survey. These weights reflected the
relative size of the occupation within the establishment and of
the establishment within the sample universe. Weights were
used to aggregate the individual establishment/occupations
into the various data series. Of the establishments surveyed,
28.0 percent (representing 87,875 employees) refused to
supply information. If data were not provided by a sample
member, the weights of responding sample members in the
same or similar “cells” were adjusted to account for the
missing data. This technique assumes that the mean value of
the nonrespondents equals the mean value of the respondents
at some detailed “cell” level. Responding and nonresponding
establishments were classified into these cells according to
industry and employment size. Responding and
In order to calculate earnings for various time
periods (hourly, weekly, and annual), data on work
schedules were also collected. For hourly workers,
scheduled hours worked per day and per week, exclusive
of overtime, were recorded. Annual weeks worked were
determined. Because salaried workers, exempt from
27
Sampling errors occur because observations come only
from a sample and not from an entire population. The sample
used for this survey is one of a number of possible samples of
the same size that could have been selected using the sample
design. Estimates derived from the different samples would
differ from each other.
A measure of the variation among these differing estimates
is called the standard error or sampling error. It indicates the
precision with which an estimate from a particular sample
approximates the average result of all possible samples. The
relative standard error (RSE) is the standard error divided by
the estimate. Appendix table 2 contains RSE data for selected
series in this bulletin. RSE data for all series in this bulletin
are available on the Internet web site and by request to the
BLS National Office.
The standard error can be used to calculate a “confidence
interval” around a sample estimate. As an example, suppose
table A-1 shows that mean hourly earnings for all workers was
$12.79 per hour, and appendix table 2 shows a relative
standard error of 3.6 percent for this estimate. At the 90percent level, the confidence interval for this estimate is
$13.55 to $12.03 ($12.79 plus and minus 1.645 times 3.6
percent times $12.79). If all possible samples were selected to
estimate the population value, the interval from each sample
would include the true population value approximately 90
percent of the time.
Nonsampling errors also affect survey results. They can
stem from many sources, such as inability to obtain
information for some establishments, difficulties with survey
definitions, inability of the respondents to provide correct
information, or mistakes in recording or coding the data
obtained. A Technical Reinterview Program done in all survey
areas will be used in the development of a formal quality
assessment process to help compute nonsampling error.
Although they also were not specifically measured, efforts
were made to minimize nonsampling errors by the extensive
training of field economists who gathered survey data,
computer editing of the data, and detailed data review.
nonresponding occupations within responding establishments
were classified into cells which were additionally defined by
major occupation group and job level.
Establishments which were determined to be out of
business or outside the scope of the survey 6.2 percent of the
total sample) had their weights changed to zero. If only
partial data were given by a sample establishment or
occupation, or data were missing, the response was treated as
a refusal.
Estimation
The wage series in the tables are computed by combining
the wages for individual establishment/occupations. Before
being combined, individual wage rates are weighted by:
number of workers; the sample weight adjusted for
nonresponding establishments and other factors; and the
occupation work schedule, varying depending on whether
hourly, weekly, or annual rates are being calculated. The
respondent has the option of giving mean data instead of
individual wages in the years following the initiation.
In 1998, the publication criteria were changed to allow
more data to publish. Not all series that were calculated met
the criteria for publication. Before any series was published,
it was reviewed to make sure that the number of observations
underlying it was sufficient.
This review prevented
publishing a series that could have revealed information about
a specific establishment.
As a result of the use of sampling weights, the number of
workers estimates represent the total in all establishments
within the scope of the study not the actual number of workers
surveyed.
Data reliability
The data in this bulletin are estimates from a scientifically
selected probability sample. There are two types of errors
possible in an estimate based on a sample survey, sampling
and nonsampling.
28
Appendix table 1. Number of establishments studied by industry division and establishment employment size,
and number of establishments represented, Buffalo-Niagara Falls, NY, July 1998
Number of establishments studied
Industry
All industries .........................................................
Private industry .................................................
Goods-producing industries ..........................
Mining .......................................................
Construction .............................................
Manufacturing ...........................................
Service-producing industries ........................
Tranportation and public utilities ...............
Wholesale and retail trade ........................
Finance, insurance and real estate ..........
Services ....................................................
State and local government ..............................
Number of
establishments represented
100 workers or more
Total studied
1,634
1,532
338
1
43
293
1,194
146
400
55
592
103
177
150
53
1
2
50
97
8
29
8
52
27
50 - 99
workers
40
39
10
1
1
8
29
4
12
2
11
1
Total
137
111
43
–
1
42
68
4
17
6
41
26
100 - 499
workers
84
79
30
–
1
29
49
3
14
2
30
5
NOTE: Dashes indicate that no data were reported. Overall industry and industry groups may include data for categories not shown separately.
29
500 workers
or more
53
32
13
–
–
13
19
1
3
4
11
21
Appendix table 2. Relative standard errors of mean hourly earnings1 for selected
occupations, all industries, private industry, and State and local government, all
workers2, Buffalo-Niagara Falls, NY, July 1998
(in percent)
Occupation3
All industries
Private
industry
State and
local
government
All occupations .......................................................................
All occupations excluding sales ............................................
2.4
2.5
3.0
3.2
3.2
3.2
White-collar occupations ...................................................
White-collar occupations excluding sales .........................
2.9
2.9
3.9
4.0
4.3
4.4
Professional specialty and technical occupations ............
Professional specialty occupations ...............................
Engineers, architects, and surveyors .......................
Electrical and electronic engineers .......................
Industrial engineers ..............................................
Engineers, N.E.C. .................................................
Mathematical and computer scientists .....................
Computer systems analysts and scientists ...........
Natural scientists ......................................................
Health related occupations .......................................
Registered nurses ................................................
Pharmacists ..........................................................
Teachers, college and university ..............................
Teachers, post secondary N.E.C. .........................
Teachers, except college and university ..................
Elementary school teachers .................................
Secondary school teachers ..................................
Librarians, archivists, and curators ...........................
Librarians ..............................................................
Social scientists and urban planners ........................
Social, recreation, and religious workers ..................
Social workers ......................................................
Lawyers and judges ..................................................
Writers, authors, entertainers, athletes, and
professionals, N.E.C. ..........................................
Technical occupations ..................................................
Clinical laboratory technologists and technicians
Licensed practical nurses .....................................
Health technologists and technicians, N.E.C. .......
Electrical and electronic technicians .....................
Drafters .................................................................
Executive, administrative, and managerial occupations ...
Executives, administrators, and managers ...............
Financial managers ..............................................
Managers, marketing, advertising and public
relations ..........................................................
Administrators, education and related fields .........
Managers, service organizations, N.E.C. .............
Managers and administrators, N.E.C. ..................
Management related occupations ............................
Accountants and auditors .....................................
Management related occupations, N.E.C. ............
Sales occupations ............................................................
Supervisors, sales occupations ............................
Sales workers, other commodities ........................
Cashiers ...............................................................
Administrative support occupations, including clerical .....
Supervisors, financial records processing ............
Computer operators ..............................................
Secretaries ...........................................................
Typists ..................................................................
Receptionists ........................................................
Information clerks, N.E.C. .....................................
Order clerks ..........................................................
Library clerks ........................................................
Records clerks, N.E.C. .........................................
Bookkeepers, accounting and auditing clerks ......
Traffic, shipping and receiving clerks ...................
General office clerks .............................................
3.0
3.1
5.8
2.4
11.4
8.3
4.3
4.5
–
3.6
1.7
3.5
13.0
3.1
4.0
6.7
4.4
16.2
16.2
–
12.0
14.0
–
4.1
4.3
6.2
2.4
11.4
8.3
7.9
–
–
3.7
2.0
3.1
9.8
–
12.0
–
–
–
–
–
16.6
18.9
–
4.9
4.6
–
–
–
–
–
–
–
8.4
2.9
–
15.4
–
4.0
4.1
4.2
–
–
–
8.6
9.8
–
8.0
3.3
4.4
3.2
5.9
11.7
8.0
4.8
6.0
16.9
8.1
3.5
3.6
3.9
5.8
12.5
8.0
5.4
6.8
16.9
–
9.1
–
–
–
–
–
7.4
9.6
–
8.6
11.3
7.0
9.3
7.8
7.2
9.1
6.8
14.5
3.9
8.8
2.7
7.5
6.9
4.9
4.5
5.5
7.5
7.8
9.5
6.1
6.9
5.5
5.0
8.6
–
7.0
9.9
9.5
7.6
12.3
6.9
14.5
3.9
4.8
2.7
7.5
–
5.6
–
5.5
6.8
7.8
–
6.2
9.5
5.5
9.7
–
10.2
–
–
9.1
–
–
–
–
–
–
5.8
–
–
4.6
5.2
–
–
–
–
–
2.5
–
4.6
See footnotes at end of table.
30
Appendix table 2. Relative standard errors of mean hourly earnings1 for selected
occupations, all industries, private industry, and State and local government, all
workers2, Buffalo-Niagara Falls, NY, July 1998 — Continued
(in percent)
Occupation3
White-collar occupations (-Continued)
Administrative support occupations, including clerical
(-Continued)
Data entry keyers .................................................
Teachers’ aides ....................................................
Administrative support occupations, N.E.C. .........
All industries
Private
industry
State and
local
government
6.9
5.2
4.9
8.2
–
5.1
–
5.7
–
Blue-collar occupations .....................................................
Precision production, craft, and repair occupations ..........
Supervisors, mechanics and repairers .................
Automobile mechanics .........................................
Industrial machinery repairers ..............................
Mechanics and repairers, N.E.C. ..........................
Supervisors, production occupations ....................
Machine operators, assemblers, and inspectors ..............
Molding and casting machine operators ...............
Laundering and dry cleaning machine operators
Packaging and filling machine operators ..............
Miscellaneous machine operators, N.E.C. ...........
Welders and cutters ..............................................
Assemblers ...........................................................
Production inspectors, checkers and examiners ..
Transportation and material moving occupations .............
Truck drivers .........................................................
Bus drivers ............................................................
Industrial truck and tractor equipment operators ..
Miscellaneous material moving equipment
operators, N.E.C. ............................................
Handlers, equipment cleaners, helpers, and laborers ......
Production helpers ................................................
Stock handlers and baggers .................................
Freight, stock, and material handlers, N.E.C. .......
Vehicle washers and equipment cleaners ............
Hand packers and packagers ...............................
Laborers except construction, N.E.C. ...................
3.6
2.4
6.4
9.6
6.4
8.1
5.9
4.6
17.4
3.4
5.1
7.6
8.2
10.6
18.2
6.7
7.7
14.5
5.2
4.0
2.5
–
–
6.4
6.9
5.9
4.7
17.4
3.4
5.1
7.8
8.2
10.6
18.2
8.7
9.1
–
5.2
5.2
5.8
–
–
–
–
–
–
–
–
–
–
–
–
–
4.4
–
2.3
–
6.7
6.6
18.4
15.1
8.5
12.1
14.1
9.3
7.6
7.2
18.4
15.1
8.5
12.1
14.1
12.0
–
7.1
–
–
–
–
–
9.5
Service occupations ...........................................................
Protective service occupations .................................
Guards and police except public service ..............
Food service occupations .........................................
Waiters and waitresses ........................................
Cooks ...................................................................
Kitchen workers, food preparation ........................
Food preparation occupations, N.E.C. .................
4.4
3.9
16.6
7.7
19.6
6.6
2.9
6.9
3.9
18.5
19.4
7.7
19.6
6.6
2.9
6.9
4.2
3.5
–
–
–
–
–
–
See footnotes at end of table.
31
Appendix table 2. Relative standard errors of mean hourly earnings1 for selected
occupations, all industries, private industry, and State and local government, all
workers2, Buffalo-Niagara Falls, NY, July 1998 — Continued
(in percent)
Occupation3
Service occupations (-Continued)
Health service occupations .......................................
Health aides, except nursing ................................
Nursing aides, orderlies and attendants ...............
Cleaning and building service occupations ..............
Maids and housemen ...........................................
Janitors and cleaners ...........................................
Personal service occupations ...................................
Welfare service aides ...........................................
1 The relative standard error is the standard error
expressed as a percent of the estimate. Hourly
earnings for these occupations are presented in Tables
A-1 and A-2. Reliable relative standard errors could
not be determined for all occupations.
2 All workers include full-time and part-time
workers. Employees are classified as working either a
full-time or a part-time schedule based on the definition
used by each establishment. Therefore, a worker with
a 35-hour-per-week schedule might be considered a
full-time employee in one establishment, but classified
as part-time in another firm, where a 40-hour week is
the minimum full-time schedule.
3 A classification system including about 480
individual occupations is used to cover all workers in
the civilian economy. Individual occupations are
classified into one of nine major occupational groups.
All industries
Private
industry
State and
local
government
3.8
13.8
3.9
4.4
9.6
4.7
10.6
3.4
3.0
15.1
2.9
5.2
10.3
5.5
7.5
3.4
5.4
–
6.1
6.4
–
6.6
11.9
–
that data did not meet publication criteria. Overall
occupational groups and occupational levels may
include data for categories not shown separately.
N.E.C. means not elsewhere classified. IN THIS SURVEY, THE NONRESPONSE RATE FOR PRIVATE INDUSTRY EXCEEDED REGULAR SURVEY STANDARDS FOR PUBLICATION. ACCORDINGLY, USERS SHOULD INTERPRET THESE RESULTS
WITH THIS LIMITATION IN MIND.
NOTE: Individual and average wage rates were
collected in this update survey. A procedure was put
into place to "move" the positional statistics where
averages were collected. This procedure compares
current locality survey data–at the quote level–with the
same quote from the prior survey. Individual rates
from the prior survey are moved by the average
change in mean wages for the occupation.
NOTE: Dashes indicate that no data were reported or
32
Appendix table 3. Average work levels for selected occupations, all workers,
full-time and part-time workers, Buffalo-Niagara Falls, NY, July 1998
All
Full-time Part-time
workers workers workers
Occupation1
All occupations .................................................................................
All occupations excluding sales ......................................................
5
5
6
6
3
3
White-collar occupations .............................................................
White-collar occupations excluding sales ...................................
6
6
7
7
4
5
Professional specialty and technical occupations ......................
Professional specialty occupations .........................................
Engineers, architects, and surveyors .................................
Electrical and electronic engineers .................................
Industrial engineers ........................................................
Engineers, N.E.C. ...........................................................
Mathematical and computer scientists ...............................
Computer systems analysts and scientists .....................
Natural scientists ................................................................
Health related occupations .................................................
Registered nurses ..........................................................
Pharmacists ....................................................................
Teachers, college and university ........................................
Teachers, post secondary N.E.C. ...................................
Teachers, except college and university ............................
Elementary school teachers ...........................................
Secondary school teachers ............................................
Librarians, archivists, and curators .....................................
Librarians ........................................................................
Social scientists and urban planners ..................................
Social, recreation, and religious workers ............................
Social workers ................................................................
Lawyers and judges ............................................................
Writers, authors, entertainers, athletes, and professionals,
N.E.C. ...........................................................................
Technical occupations ............................................................
Clinical laboratory technologists and technicians ...........
Licensed practical nurses ...............................................
Health technologists and technicians, N.E.C. .................
Electrical and electronic technicians ...............................
Drafters ...........................................................................
Executive, administrative, and managerial occupations .............
Executives, administrators, and managers .........................
Financial managers ........................................................
Managers, marketing, advertising and public relations ..
Administrators, education and related fields ...................
Managers, service organizations, N.E.C. .......................
Managers and administrators, N.E.C. ............................
Management related occupations ......................................
Accountants and auditors ...............................................
Management related occupations, N.E.C. ......................
Sales occupations ......................................................................
Supervisors, sales occupations ......................................
Sales workers, other commodities ..................................
Cashiers .........................................................................
Administrative support occupations, including clerical ...............
Supervisors, financial records processing ......................
Computer operators ........................................................
Secretaries .....................................................................
Typists ............................................................................
Receptionists ..................................................................
Information clerks, N.E.C. ...............................................
Order clerks ....................................................................
Library clerks ..................................................................
Records clerks, N.E.C. ...................................................
Bookkeepers, accounting and auditing clerks ................
Traffic, shipping and receiving clerks .............................
Stock and inventory clerks ..............................................
General office clerks .......................................................
Data entry keyers ...........................................................
Teachers’ aides ..............................................................
Administrative support occupations, N.E.C. ...................
8
9
10
10
8
11
10
10
–
8
8
9
11
10
8
8
9
9
9
–
7
7
–
9
9
10
10
8
11
10
10
–
9
8
9
12
–
8
8
9
9
9
–
7
7
–
7
7
–
–
–
–
–
–
–
8
8
–
7
–
6
–
–
–
–
–
–
–
–
8
6
7
5
5
6
7
10
10
11
10
11
9
11
9
9
8
4
6
3
2
4
7
6
5
4
2
4
4
4
4
4
4
–
3
2
2
3
8
6
8
6
5
6
7
10
10
11
10
11
9
11
9
9
8
5
6
4
3
4
7
6
5
4
3
4
4
4
4
4
4
3
4
2
–
4
–
5
–
5
–
–
–
–
–
–
–
–
–
–
–
–
–
2
–
3
2
2
–
–
4
–
–
–
–
–
–
–
–
–
2
–
–
2
Blue-collar occupations ...............................................................
4
5
2
See footnotes at end of table.
33
Appendix table 3. Average work levels for selected occupations, all workers,
full-time and part-time workers, Buffalo-Niagara Falls, NY, July 1998 — Continued
All
Full-time Part-time
workers workers workers
Occupation1
Blue-collar occupations (-Continued)
Precision production, craft, and repair occupations ....................
Supervisors, mechanics and repairers ...........................
Automobile mechanics ...................................................
Industrial machinery repairers ........................................
Mechanics and repairers, N.E.C. ....................................
Supervisors, production occupations ..............................
Machine operators, assemblers, and inspectors ........................
Molding and casting machine operators .........................
Laundering and dry cleaning machine operators ...........
Packaging and filling machine operators ........................
Miscellaneous machine operators, N.E.C. .....................
Welders and cutters ........................................................
Assemblers .....................................................................
Production inspectors, checkers and examiners ............
Transportation and material moving occupations .......................
Truck drivers ...................................................................
Bus drivers ......................................................................
Industrial truck and tractor equipment operators ............
Miscellaneous material moving equipment operators,
N.E.C. .......................................................................
Handlers, equipment cleaners, helpers, and laborers ................
Production helpers ..........................................................
Stock handlers and baggers ...........................................
Freight, stock, and material handlers, N.E.C. .................
Vehicle washers and equipment cleaners ......................
Hand packers and packagers .........................................
Laborers except construction, N.E.C. .............................
7
8
6
7
6
8
4
3
2
4
4
4
3
4
4
4
4
5
7
8
6
7
6
8
4
–
–
4
4
4
3
4
4
4
–
5
–
–
–
–
–
–
2
–
–
–
–
–
–
–
4
–
4
–
4
2
2
2
3
2
2
2
4
2
2
2
3
–
2
3
–
2
–
–
2
–
–
–
Service occupations .....................................................................
Protective service occupations ...........................................
Guards and police except public service ........................
Food service occupations ...................................................
Waiters and waitresses ..................................................
Cooks .............................................................................
Kitchen workers, food preparation ..................................
Food preparation occupations, N.E.C. ...........................
Health service occupations .................................................
Health aides, except nursing ..........................................
Nursing aides, orderlies and attendants .........................
Cleaning and building service occupations ........................
Maids and housemen .....................................................
Janitors and cleaners .....................................................
Personal service occupations .............................................
Welfare service aides .....................................................
3
6
4
2
3
4
2
2
3
3
3
3
2
3
3
2
4
7
–
3
–
–
–
2
3
4
3
3
–
3
3
–
2
3
–
2
3
–
–
2
2
–
2
2
–
1
2
2
1 A classification system including about 480
individual occupations is used to cover all workers in
the civilian economy. Individual occupations are
classified into one of nine major occupational groups.
The occupations titled authors, musicians, actors,
painters, photographers, dancers, artists, athletes, and
legislators cannot be assigned a work level.
include data for categories not shown separately.
N.E.C. means "not elsewhere classified."
NOTE: Individual and average wage rates were
collected in this update survey. A procedure was put
into place to "move" the positional statistics where
averages were collected. This procedure compares
current locality survey data–at the quote level–with the
same quote from the prior survey. Individual rates
from the prior survey are moved by the average
change in mean wages for the occupation.
NOTE: Dashes indicate that no data were reported or
that data did not meet publication criteria. Overall
occupational groups and occupational levels may
34
© Copyright 2026 Paperzz