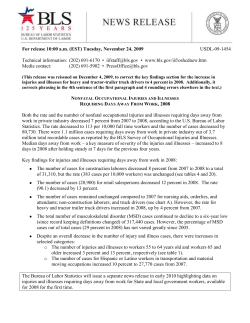
For release 10:00 a.m. (EST) Tuesday, November 24, 2009
USDL-09-1454
Technical information: (202) 691-6170 • [email protected] • www.bls.gov/iif/oshcdnew.htm
Media contact:
(202) 691-5902 • [email protected]
(This release was reissued on December 4, 2009, to correct the key findings section for the increase in
injuries and illnesses for heavy and tractor-trailer truck drivers to 4 percent in 2008. Additionally, it
corrects phrasing in the 4th sentence of the first paragraph and 4 rounding errors elsewhere in the text.)
NONFATAL OCCUPATIONAL INJURIES AND ILLNESSES
REQUIRING DAYS AWAY FROM WORK, 2008
Both the rate and the number of nonfatal occupational injuries and illnesses requiring days away from
work in private industry decreased 7 percent from 2007 to 2008, according to the U.S. Bureau of Labor
Statistics. The rate decreased to 113 per 10,000 full time workers and the number of cases decreased by
80,730. There were 1.1 million cases requiring days away from work in private industry out of 3.7
million total recordable cases as reported by the BLS Survey of Occupational Injuries and Illnesses.
Median days away from work – a key measure of severity of the injuries and illnesses – increased to 8
days in 2008 after holding steady at 7 days for the previous four years.
Key findings for injuries and illnesses requiring days away from work in 2008:
The number of cases for construction laborers decreased 8 percent from 2007 to 2008 to a total
of 31,310, but the rate (383 cases per 10,000 workers) was unchanged (see tables 4 and 20).
The number of cases (28,900) for retail salespersons decreased 12 percent in 2008. The rate
(90.1) decreased by 13 percent.
The number of cases remained unchanged compared to 2007 for nursing aids, orderlies, and
attendants; non-construction laborers; and truck drivers (see chart A). However, the rate for
heavy and tractor trailer truck drivers increased in 2008, up by 4 percent from 2007.
The total number of musculoskeletal disorder (MSD) cases continued to decline to a six-year low
(since record keeping definitions changed) of 317,440 cases. However, the percentage of MSD
cases out of total cases (29 percent in 2008) has not varied greatly since 2005.
Despite an overall decrease in the number of injury and illness cases, there were increases in
selected categories:
o The number of injuries and illnesses to workers 55 to 64 years old and workers 65 and
older increased 3 percent and 13 percent, respectively (see table 1).
o The number of cases for Hispanic or Latino workers in transportation and material
moving occupations increased 10 percent to 27,770 cases from 2007.
The Bureau of Labor Statistics will issue a separate news release in early 2010 highlighting data on
injuries and illnesses requiring days away from work for State and local government workers, available
for 2008 for the first time.
Chart A. Occupations with a high number of days-away-from-work cases, 2005-2008
100,000
80,000
2005
2006
2007
60,000
2008
40,000
20,000
0
Laborers and freight,
stock, and
material movers
Heavy and tractortrailer truck drivers
Nursing aides,
orderlies,
and attendants
Construction
laborers
Retail
salespersons
Occupation
Eight occupations had more than 20,000 injuries and illnesses in 2008 (see table 4), as they have every
year since 2003. These eight occupations made up 30 percent of all injuries and illnesses with days away
from work in 2008.
Laborers and freight, stock, and material movers experienced the highest number of days-awayfrom-work injuries and illnesses in 2008, with 79,590 cases, substantially unchanged from 2007
levels. The median days away from work for this occupation increased by one day to 8 days,
from 2007.
Heavy and tractor-trailer truck drivers had 57,700 cases with days away from work and required
17 median days away from work to recuperate, up from 15 days in 2007. While the number of
cases did not increase significantly from 2007, the rate per 10,000 full time workers for heavy
and tractor-trailer truck drivers increased 4 percent from 2007.
Carpenters (for whom the number of days-away-from-work cases decreased by 24 percent from
2007 levels) had fewer than 20,000 injuries and illnesses for the first time since 2003.
Seven occupations (with at least 0.1 percent of total employment) had days-away-from-work rates three
times greater than the all-worker rate of 113 cases per 10,000 full time workers (see table 20).
2
The rate for nursing aides, orderlies, and attendants was 449 per 10,000 full time workers and
decreased by 4 percent while the number of cases did not change significantly from 2007.
Nursing aides, orderlies and attendants required a median of 5 days to recuperate from injuries
and illnesses, which is 3 days fewer than for all occupations.
The rate for laborers and freight, stock, and material movers (440) and construction laborers
(383) did not change significantly from 2007.
The days-away-from-work rate for reservation and transportation ticket agents and travel clerks
increased 16 percent and the rate for emergency medical technicians and paramedics increased
by 11 percent.
Industry
In private industry, four industry sectors accounted for three-fourths of injuries and illnesses with days
away from work in 2008 (see table 1) – trade, transportation and utilities (30 percent); education and
health services (17 percent); manufacturing (15 percent); and construction (11 percent). Except the
education and health services industry, each of these industry sectors had significant decreases in the
number of days away from work cases.
Within the educational and health services industry, some occupations experienced an increase in
days-away-from-work cases in 2008 compared to 2007: management, business, and financial
occupations (19 percent increase) and office and administrative support occupations (8 percent
increase).
The manufacturing industry reported a 12 percent decrease in days-away-from-work cases, led
by a 14 percent decrease in cases for workers in production occupations and a 9 percent decrease
in transportation and material moving occupations (see table 3).
The construction industry experienced decreases in numbers and rates of days-away-from-work
cases from 2007. The number of cases declined by 11 percent to 120,240 in 2008, and the rate
fell 8 percent to 174 cases of days away from work per 10,000 full-time workers (see table 7).
Trade transportation and utilities and manufacturing each had a 9 percent decrease in their
incidence rate, to 144 and 121 respectively.
Worker characteristics
Worker characteristics include age, gender, race or ethnic origin, and length of service with the
employer at the time of the incident (see tables 1, 2, and 8).
Age. Workers who were 20 to 24 years of age had a days-away-from-work rate of 119 cases per 10,000
full-time workers, which was a decrease of 11 percent from 2007 (see table 16). The only age group
with an increase in the rate (6 percent) was workers 65 years and older. For this age group, there was a
23 percent increase in the number of injury and illness cases for transportation and material moving
occupations to 6,190. The number of cases in all other occupation groups either increased or did not
significantly change from 2007 for this age group.
3
Workers age 65 and over experienced the longest absences from work in 2008 with a median of 15 days,
which was one day less than required in 2007. Workers age 14 to 15 and 16 to 19 required a median of 4
days of recuperation. The median number of days increased by one day for workers age 14 to 15, 20 to
24, and 35 to 44.
Gender. Men accounted for 64 percent of days-away-from-work cases, the same proportion as in 2007.
The rate for men and women decreased in 2008 by 7 percent and 8 percent, respectively (see table 16).
Men continued to have a higher incidence rate (125) than women (97).
Race or ethnicity. The number of injuries and illnesses decreased by 11 percent for both white workers
(464,500) and black workers (83,970), and decreased by 7 percent for Hispanic or Latino workers
(145,870). The number of cases increased 10 percent for Hispanic or Latino workers in transportation
and material moving occupations (27,770), despite the overall decrease in this ethnic category. Race or
ethnicity was unreported in 33 percent of days-away-from-work cases.
Case characteristics
A number of variables describe the circumstances of workplace injuries and illnesses that required one
or more days away from work. They include nature, part of body, source, and event or exposure, as well
as “musculoskeletal disorders” (an amalgamation of selected nature and event or exposure categories).
A nursing aide sprains her back from overexertion in lifting a health care patient.
↑
↑
↑
↑
(nature) (part of body) (event or exposure)
(source)
Event or exposure. In 2008, three event or exposure categories accounted for 65 percent of the total
injuries and illnesses requiring days away from work: contact with objects and equipment; overexertion;
and fall on same level (see table 6). Contact with objects and equipment decreased by 8 percent and
overexertion and fall on the same level each decreased 5 percent.
Contact with objects and equipment was the most frequent event associated with injuries to
laborers and freight, stock, and material movers, and construction laborers (see table A).
Of the injuries incurred from contact with objects or equipment, 31 percent were cuts,
lacerations, or punctures; 17 percent were bruises or contusions; and 12 percent were fractures.
Instances of overexertion accounted for 48 percent of the injuries and illnesses to nursing aides,
orderlies, and attendants despite a 9 percent decrease in cases from 2007.
Repetitive motion continued to be the event with the highest median days away from work for all
private industries with 18 days, two fewer days than in 2007 (see table 11). Falls to lower level
required a median of 15 days away from work to recuperate. Overexertion and falls on the same
level each increased from 9 to 10 median days away from work in 2008.
4
Table A. Leading event or exposure for selected occupations, 2008
Leading Event
(percent of total)
Days away
from work
cases
Incidence rate
per 10,000 fulltime workers
Laborers and freight, stock, and material movers, hand
79,590
440.3
Contact with object or equipment (35%),
Overexertion (30%)
Truck drivers, heavy and tractor-trailer
57,700
362.0
Overexertion (21%), Contact with object or
equipment (20%)
Nursing aides, orderlies, and attendants
44,610
449.0
Overexertion (48%), Fall on same level
(16%)
Construction laborers
31,310
383.1
Contact with object or equipment (40%),
Overexertion (19%)
Retail salespersons
28,900
90.1
Contact with object or equipment (27%),
Overexertion (26%)
Selected Occupations
Nature of injury or illness. In 2008, sprain or strain injuries accounted for 39 percent of total injury and
illness cases requiring days away from work, decreasing 7 percent to 416,620 cases (see table 5).
Soreness and pain (including the back) accounted for 11 percent of total cases. The number of soreness
and pain cases did not significantly change from 2007.
Forty-five percent of sprains or strains were the result of overexertion (see chart B). Bodily
reaction (such as bending, reaching, twisting, or slipping without falling) accounted for another
22 percent and 11 percent were the result of falls on the same level.
In 40 percent of the sprain and strain cases, the back was injured. In another 25 percent of the
cases, a lower extremity (typically the knee or ankle) was injured.
Twenty-three percent of sprains and strains occurred to workers in service occupations,
decreasing by 4 percent. Workers in production occupations had a decrease of 7,890 sprains or
strains cases, down to 43,970 in 2008.
While the incidence rate per 10,000 full time workers for sprains and strains decreased in most
industries, the rate did not change significantly from 2007 in utilities (53.0), information (29.4)
and real estate and rental and leasing (46.4).
Workers who sustained fractures or suffered from carpal tunnel syndrome required a median of
28 days to recuperate (see table 11). Amputation injuries required 26 days in 2008, up from 21
days in 2007. Sprains or strains required 9 median days, up from 8 in 2007.
5
Chart B. Sprains and strains by event or exposure and part of body, 2008
Contact with
object,
equipment
6.9%
Fall to lower
level
4.6%
All other
25.8%
All other
27.1%
Fall on same
level
11.1%
Back
40.2%
Slips, trips
6.9%
Ankle
8.7%
Overexertion
44.8%
Knee
12.4%
Shoulder
11.7%
Total sprains and strains = 416,620
Sprains and strains by
part of body
Sprains and strains by event
Musculoskeletal disorders. Musculoskeletal disorders (MSDs), often referred to as ergonomic injuries,
accounted for 29 percent of all workplace injuries and illnesses requiring time away from work in 2008,
the same percentage as in 2007. A definition of musculoskeletal disorders can be found on the BLS
website https://www.bls.gov/iif/oshdef.htm.
There were 317,440 MSDs in 2008 requiring a median of 10 days away from work, two more
days than the median for all days-away-from-work cases. The number of cases declined by
17,950 (5 percent) from 2007, and by 11 percent from 2006. The rate of MSD injuries declined
to 33 cases per 10,000 full time workers, from 35 cases in 2007.
Transportation and material moving occupations had the highest number of MSD cases with
66,240. In this occupation group, injuries and illnesses to the shoulder (10,870 cases) and knee
(4,260 cases) required a median of 30 days to recuperate. Production occupations and healthcare
support occupations had 42,720 and 29,640 MSD cases respectively (see table B).
The MSD rate for several industries decreased significantly from last year. The MSD incidence
rate for professional and business services decreased 17 percent to 14 cases per 10,000 workers
and the rate for the retail trade industry decreased 10 percent to a rate of 38. Health care and
social assistance decreased 5 percent to a rate of 53.
6
Table B. Median number of days away from work for injuries involving musculoskeletal disorders (MSDs)
by occupation group and selected part of body, 2008
Median days away from work by
Selected Part of Body
Total MSDs
Major Occupation Group
Case
counts
Incidence
rates
Total
Back
Shoulder
Arm
Wrist
Knee
317,440
33
10
6
18
17
16
21
Transportation and material moving occupations
66,240
85
12
8
30
27
12
30
Production occupations
42,720
49
13
5
19
15
18
23
Healthcare support occupations
29,640
110
6
5
8
8
6
11
Construction and extraction occupations
28,880
53
11
7
30
45
27
26
Installation, maintenance, and repair occupations
27,540
61
12
6
19
15
12
52
All occupations
Notes
This release is the third in a series of releases from the BLS covering occupational safety and health
statistics in 2008. The first release, in August 2009, covered work-related fatalities from the 2008
Census of Fatal Occupational Injuries. In October 2009, the Survey of Occupational Injuries and
Illnesses (SOII) reported the total recordable cases for occupational injuries and illnesses for 2008. A
fourth release of data from the BLS SOII program is scheduled for early 2010. This release will provide
case and demographic data on injury and illness cases requiring days away from work for public sector
workers in State and local governments. Additional background and methodological information
regarding the BLS occupational safety and health program can be found in Chapter 9 of the BLS
Handbook of Methods at https://www.bls.gov/opub/hom/pdf/homch9.pdf.
Because of space limitations, this release does not present all the publishable estimates and rates for
days-away-from-work cases. Additional detailed data are available from BLS staff on 202-691-6170,
[email protected], and the BLS Internet site at https://www.bls.gov/iif/home.htm.
7
TABLE 1. Number of nonfatal occupational injuries and illnesses involving days away from work1 by selected worker characteristics and major industry sector, 2008
Goods producing
Characteristic
Service providing
Total
goods
producing
Natural
resources
and
mining2,3
Construction
Manufacturing
Total
service
providing
Trade,
transportation and
utilities4
Information
Financial
activities
Professional
and
business
services
Education
and
health
services
Leisure
and
hospitality
Other
services
311,890
26,710
120,240
164,940
766,250
328,220
18,070
35,010
85,540
182,750
86,190
30,470
688,790
384,930
269,780
41,820
23,760
2,820
117,240
2,980
128,780
36,020
419,010
343,100
229,630
95,070
12,980
5,090
19,480
15,530
56,080
29,040
36,650
145,980
42,040
44,110
22,160
8,280
130
31,010
107,880
239,580
251,490
261,030
142,840
28,420
20
6,370
31,530
77,440
77,350
74,630
35,540
5,230
–
840
3,780
7,690
5,530
5,350
2,630
420
–
2,410
13,540
35,940
31,260
25,090
9,710
1,010
–
3,110
14,210
33,800
40,560
44,190
23,200
3,800
110
24,640
76,360
162,150
174,150
186,400
107,300
23,190
40
10,780
34,510
66,800
74,590
80,690
45,650
10,710
–
320
900
3,670
5,340
4,560
2,360
430
–
490
2,820
7,050
7,730
10,080
4,990
1,670
–
1,660
8,910
19,920
20,800
18,580
11,090
1,890
–
2,770
15,670
36,710
40,830
48,450
30,230
5,800
50
7,800
10,500
19,840
17,930
16,870
9,410
2,160
–
820
3,050
8,160
6,920
7,160
3,570
510
117,130
218,510
388,160
338,320
38,170
60,690
111,660
98,240
5,340
6,640
8,720
5,550
17,350
26,590
46,380
28,840
15,480
27,460
56,560
63,860
78,970
157,820
276,510
240,070
31,650
63,680
116,670
109,010
1,020
2,240
4,760
9,540
3,750
7,520
12,480
11,100
11,670
20,470
29,900
21,630
14,130
35,610
69,800
61,370
13,570
21,930
31,960
17,590
3,180
6,370
10,940
9,840
464,500
83,970
145,870
15,090
159,960
18,040
59,550
3,690
8,600
410
9,110
100
66,810
4,850
25,360
560
84,550
12,770
25,090
3,040
304,540
65,930
86,320
11,400
127,830
18,800
31,810
2,720
5,580
870
810
160
14,580
2,810
5,310
330
32,360
7,830
16,860
1,200
76,690
26,560
14,730
3,450
30,830
7,270
12,850
3,170
16,680
1,790
3,960
360
2,920
690
40
310
350
2,230
780
60
110
240
540
470
30
4,230
930
760
359,870
1,430
350
220
67,980
180
70
–
8,200
650
150
70
21,480
610
130
130
38,300
2,800
580
550
291,890
1,040
60
190
144,990
50
–
–
10,530
180
–
–
11,690
120
30
–
26,910
690
60
150
59,880
680
420
170
30,330
50
–
–
7,570
Private
industry
2,3,4
Total cases .............................................. 1,078,140
Gender:
Male .....................................................
Female .................................................
Age:5
14 - 15 .................................................
16 - 19 .................................................
20 - 24 .................................................
25 - 34 .................................................
35 - 44 .................................................
45 - 54 .................................................
55 - 64 .................................................
65 and over ..........................................
Length of service with employer:
Less than 3 months .............................
3 - 11 months .......................................
1 - 5 years ............................................
More than 5 years ................................
Race or ethnic origin:
White only ............................................
Black only ............................................
Hispanic or Latino only ........................
Asian only ............................................
Native Hawaiian or Pacific Islander
only ....................................................
American Indian or Alaskan Native
only ....................................................
Hispanic or Latino and other race ........
Multi-race .............................................
Not reported .........................................
1 Days-away-from-work cases include those that resulted in days away from work, some of which
also included job transfer or restriction.
2 Excludes farms with fewer than 11 employees.
3 Data for Mining (Sector 21 in the North American Industry Classification System-- United States,
2002) include establishments not governed by the Mine Safety and Health Administration rules and
reporting, such as those in Oil and Gas Extraction and related support activities. Data for mining
operators in coal, metal, and nonmetal mining are provided to BLS by the Mine Safety and Health
Administration, U.S. Department of Labor. Independent mining contractors are excluded from the
coal, metal, and nonmetal mining industries. These data do not reflect the changes the Occupational
Safety and Health Administration made to its recordkeeping requirements effective January 1, 2002;
therefore, estimates for these industries are not comparable to estimates in other industries.
4 Data for employers in rail transportation are provided to BLS by the Federal Railroad
Administration, U.S. Department of Transportation.
5 Information is not shown separately for injured workers under age 14; they accounted for fewer
than 50 cases.
NOTE: Dash indicates data do not meet publication guidelines. Because of rounding and data
exclusion of nonclassifiable responses, data may not sum to the totals.
SOURCE: Bureau of Labor Statistics, U.S. Department of Labor, Survey of Occupational Injuries
and Illnesses in cooperation with participating State agencies
8
TABLE 2. Percent distribution of nonfatal occupational injuries and illnesses involving days away from work1 by selected worker characteristics and major industry sector,
2008
Goods producing
Service providing
Characteristic
Private
industry 2,3,4
Total
goods
producing
Natural
resources
and
mining2,3
Construction
Manufacturing
Total
service
providing
Trade,
transportation and
utilities4
Information
Financial
activities
Professional
and
business
services
Education
and
health
services
Leisure
and
hospitality
Other
services
Total [1,078,140 cases] ..........................
100.0
100.0
100.0
100.0
100.0
100.0
100.0
100.0
100.0
100.0
100.0
100.0
100.0
63.9
35.7
86.5
13.4
89.0
10.6
97.5
2.5
78.1
21.8
54.7
44.8
70.0
29.0
71.8
28.2
55.6
44.4
65.6
33.9
20.1
79.9
48.8
51.2
72.7
27.2
(6)
2.9
10.0
22.2
23.3
24.2
13.2
2.6
(6)
2.0
10.1
24.8
24.8
23.9
11.4
1.7
–
3.1
14.2
28.8
20.7
20.0
9.8
1.6
–
2.0
11.3
29.9
26.0
20.9
8.1
.8
–
1.9
8.6
20.5
24.6
26.8
14.1
2.3
(6)
3.2
10.0
21.2
22.7
24.3
14.0
3.0
(6)
3.3
10.5
20.4
22.7
24.6
13.9
3.3
–
1.8
5.0
20.3
29.6
25.2
13.1
2.4
–
1.4
8.1
20.1
22.1
28.8
14.3
4.8
–
1.9
10.4
23.3
24.3
21.7
13.0
2.2
–
1.5
8.6
20.1
22.3
26.5
16.5
3.2
.1
9.0
12.2
23.0
20.8
19.6
10.9
2.5
–
2.7
10.0
26.8
22.7
23.5
11.7
1.7
10.9
20.3
36.0
31.4
12.2
19.5
35.8
31.5
20.0
24.9
32.6
20.8
14.4
22.1
38.6
24.0
9.4
16.6
34.3
38.7
10.3
20.6
36.1
31.3
9.6
19.4
35.5
33.2
5.6
12.4
26.3
52.8
10.7
21.5
35.6
31.7
13.6
23.9
35.0
25.3
7.7
19.5
38.2
33.6
15.7
25.4
37.1
20.4
10.4
20.9
35.9
32.3
43.1
7.8
13.5
1.4
51.3
5.8
19.1
1.2
32.2
1.5
34.1
.4
55.6
4.0
21.1
.5
51.3
7.7
15.2
1.8
39.7
8.6
11.3
1.5
38.9
5.7
9.7
.8
30.9
4.8
4.5
.9
41.6
8.0
15.2
.9
37.8
9.2
19.7
1.4
42.0
14.5
8.1
1.9
35.8
8.4
14.9
3.7
54.7
5.9
13.0
1.2
.3
.2
.1
.3
.2
.3
.2
.3
.3
.3
.3
.5
.1
.4
.1
.1
33.4
.5
.1
.1
21.8
.7
.3
.5
.1
.1
17.9
.4
.1
.1
23.2
.4
.1
.1
38.1
.3
(6)
.1
44.2
.3
–
–
58.3
.5
–
–
33.4
.1
(6)
–
31.5
.4
(6)
.1
32.8
.8
.5
.2
35.2
.2
–
–
24.8
Gender:
Male .....................................................
Female .................................................
Age:5
14 - 15 .................................................
16 - 19 .................................................
20 - 24 .................................................
25 - 34 .................................................
35 - 44 .................................................
45 - 54 .................................................
55 - 64 .................................................
65 and over ..........................................
Length of service with employer:
Less than 3 months .............................
3 - 11 months .......................................
1 - 5 years ............................................
More than 5 years ................................
Race or ethnic origin:
White only ............................................
Black only ............................................
Hispanic or Latino only ........................
Asian only ............................................
Native Hawaiian or Pacific Islander
only ....................................................
American Indian or Alaskan Native
only ....................................................
Hispanic or Latino and other race ........
Multi-race .............................................
Not reported .........................................
–
30.7
1 Days-away-from-work cases include those that resulted in days away from work, some of which
also included job transfer or restriction.
2 Excludes farms with fewer than 11 employees.
3 Data for Mining (Sector 21 in the North American Industry Classification System-- United States,
2002) include establishments not governed by the Mine Safety and Health Administration rules and
reporting, such as those in Oil and Gas Extraction and related support activities. Data for mining
operators in coal, metal, and nonmetal mining are provided to BLS by the Mine Safety and Health
Administration, U.S. Department of Labor. Independent mining contractors are excluded from the
coal, metal, and nonmetal mining industries. These data do not reflect the changes the Occupational
Safety and Health Administration made to its recordkeeping requirements effective January 1, 2002;
therefore, estimates for these industries are not comparable to estimates in other industries.
4 Data for employers in rail transportation are provided to BLS by the Federal Railroad
Administration, U.S. Department of Transportation.
5 Information is not shown separately for injured workers under age 14; they accounted for fewer
than 50 cases.
6 Data too small to be displayed.
NOTE: Dash indicates data do not meet publication guidelines. Because of rounding and data
exclusion of nonclassifiable responses, percentages may not add to 100.
SOURCE: Bureau of Labor Statistics, U.S. Department of Labor, Survey of Occupational Injuries
and Illnesses in cooperation with participating State agencies
9
TABLE 3. Number of nonfatal occupational injuries and illnesses involving days away from work1 by major occupational group and major industry sector, 2008
Goods producing
Occupation
Natural
resources
and
mining2,3
Construction
Manufacturing
Total
service
providing
Trade,
transportation and
utilities4
Information
Financial
activities
Professional
and
business
services
Education
and
health
services
Leisure
and
hospitality
Other
services
311,890
26,710
120,240
164,940
766,250
328,220
18,070
35,010
85,540
182,750
86,190
30,470
19,650
6,660
3,280
5,000
2,260
8,960
1,460
8,650
3,330
720
250
2,000
710
–
–
–
340
160
–
100
140
–
–
–
1,700
220
–
600
–
–
–
–
1,290
350
220
1,300
560
–
–
–
16,320
5,940
3,030
2,990
1,540
8,960
1,460
8,640
2,770
1,630
380
510
80
80
20
20
570
100
910
500
–
–
–
60
2,220
1,500
510
100
260
60
60
–
2,750
1,320
840
1,650
690
290
1,300
60
5,530
1,160
300
120
430
7,870
60
7,960
1,730
170
30
–
30
50
–
110
740
60
80
90
40
610
–
420
6,230
160
–
20
140
6,060
670
1,300
40
260
530
3,070
200
44,950
65,720
10,860
100
–
280
–
–
–
110
70
–
130
44,850
65,710
10,570
1,280
330
680
–
–
140
190
440
1,580
1,620
6,190
41,780
63,140
1,290
30
280
1,640
30
150
290
2,3,4
Total cases ............................................................. 1,078,140
Management occupations ....................................
Business and financial operations occupations ...
Computer and mathematical occupations ............
Architecture and engineering occupations ...........
Life, physical, and social science occupations .....
Community and social services occupations .......
Legal occupations ................................................
Education, training, and library occupations ........
Arts, design, entertainment, sports, and media
occupations ........................................................
Healthcare practitioners and technical
occupations ........................................................
Healthcare support occupations ...........................
Protective service occupations .............................
Food preparation and serving related
occupations ........................................................
Building and grounds cleaning and maintenance
occupations ........................................................
Personal care and service occupations ...............
Sales and related occupations .............................
Office and administrative support occupations ....
Farming, fishing, and forestry occupations ..........
Construction and extraction occupations .............
Installation, maintenance, and repair occupations
Production occupations ........................................
Transportation and material moving occupations
Service providing
Total
goods
producing
Private
industry
30
40
40
67,160
330
20
50
270
66,830
10,980
220
190
1,020
8,130
45,960
330
68,670
22,920
69,410
80,410
13,510
120,890
93,880
138,890
217,070
3,850
80
1,770
6,770
11,510
108,220
24,420
108,420
38,590
340
30
30
210
11,000
6,490
1,630
1,840
4,270
1,070
20
750
630
–
94,660
10,820
4,370
5,050
2,440
30
990
5,930
500
7,070
11,970
102,210
29,280
64,820
22,850
67,640
73,640
2,000
12,670
69,460
30,480
178,470
3,720
5,980
58,860
35,890
1,260
5,150
35,260
16,190
146,190
380
100
790
2,820
–
220
7,040
1,510
1,460
5,910
70
2,270
9,120
–
1,450
5,400
410
4,390
23,280
710
1,720
11,350
400
3,110
6,100
5,320
13,420
14,500
8,970
400
10,250
40
930
3,170
1,910
3,960
14,550
3,980
3,010
2,110
70
680
2,430
2,050
4,150
2,480
3,030
590
2,100
30
1,120
10,060
3,090
4,900
1 Days-away-from-work cases include those that resulted in days away from work, some of which also
included job transfer or restriction.
2 Excludes farms with fewer than 11 employees.
3 Data for Mining (Sector 21 in the North American Industry Classification System-- United States,
2002) include establishments not governed by the Mine Safety and Health Administration rules and
reporting, such as those in Oil and Gas Extraction and related support activities. Data for mining operators
in coal, metal, and nonmetal mining are provided to BLS by the Mine Safety and Health Administration,
U.S. Department of Labor. Independent mining contractors are excluded from the coal, metal, and
nonmetal mining industries. These data do not reflect the changes the Occupational Safety and Health
Administration made to its recordkeeping requirements effective January 1, 2002; therefore, estimates for
these industries are not comparable to estimates in other industries.
4 Data for employers in rail transportation are provided to BLS by the Federal Railroad Administration,
U.S. Department of Transportation.
NOTE: Dash indicates data do not meet publication guidelines. Because of rounding and data
exclusion of nonclassifiable responses, data may not sum to the totals.
SOURCE: Bureau of Labor Statistics, U.S. Department of Labor, Survey of Occupational Injuries and
Illnesses in cooperation with participating State agencies
10
TABLE 4. Number of nonfatal occupational injuries and illnesses involving days away from work1 by selected worker occupation and major industry sector, 2008
Goods producing
Occupation
Natural
resources
and
mining2,3
Construction
Manufacturing
Total
service
providing
Trade,
transportation and
utilities4
Information
Financial
activities
Professional
and
business
services
Education
and
health
services
Leisure
and
hospitality
Other
services
311,890
26,710
120,240
164,940
766,250
328,220
18,070
35,010
85,540
182,750
86,190
30,470
79,590
57,700
44,610
31,310
28,900
15,360
9,720
–
28,250
240
590
1,700
–
170
–
280
3,200
–
27,150
70
14,490
4,830
–
930
170
64,230
47,980
44,610
3,060
28,660
54,400
40,480
–
1,200
27,140
540
150
–
70
100
2,170
650
100
530
370
3,750
5,400
480
1,070
170
810
60
44,000
20
70
1,330
340
–
100
740
1,240
890
30
70
70
28,110
28,040
20,800
19,070
18,650
18,160
18,020
2,790
2,360
5,700
–
90
16,520
1,050
110
210
360
–
–
20
30
670
420
1,150
–
20
15,370
120
2,010
1,730
4,190
–
60
1,130
900
25,330
25,670
15,100
19,070
18,560
1,640
16,980
2,480
21,990
4,800
–
170
730
15,780
280
190
220
–
–
–
40
3,620
310
2,620
80
480
270
60
8,540
1,700
2,240
190
2,360
180
390
5,710
300
1,870
18,780
7,080
240
580
3,270
700
1,690
–
8,240
150
100
1,410
480
1,650
–
220
60
30
15,310
14,440
13,500
12,360
240
250
420
30
20
90
180
60
250
–
60
180
80
30
15,070
14,190
13,070
12,320
14,460
9,960
660
10,370
–
–
60
390
1,320
–
150
190
7,550
170
50
40
810
170
300
40
2,050
1,510
40
3,580
620
60
12,280
10,870
10,320
10,120
9,230
9,160
8,270
8,120
8,000
7,970
7,820
–
9,240
9,230
360
8,350
–
120
–
160
–
4,030
–
220
150
–
30
–
20
–
–
–
650
–
1,280
8,170
40
7,750
–
–
–
–
–
50
–
7,730
910
320
570
–
100
–
160
–
3,330
12,270
1,630
1,090
9,760
880
9,160
8,150
8,120
7,840
7,950
3,790
5,750
980
400
4,210
460
240
530
–
2,520
70
1,980
–
–
–
–
130
130
390
1,760
160
–
5,230
90
140
140
240
480
–
180
370
190
–
970
8,020
940
250
200
5,880
–
60
190
20
8,830
850
–
4,130
7,430
30
–
510
–
160
30
60
120
–
60
30
950
2,3,4
Total cases ............................................................. 1,078,140
Laborers and freight, stock, and material movers,
hand .....................................................................
Truck drivers, heavy and tractor-trailer ..................
Nursing aides, orderlies, and attendants ................
Construction laborers .............................................
Retail salespersons ................................................
Janitors and cleaners, except maids and
housekeeping cleaners ........................................
Truck drivers, light or delivery services ..................
Maintenance and repair workers, general ..............
Registered nurses ..................................................
Maids and housekeeping cleaners .........................
Carpenters .............................................................
Stock clerks and order fillers ..................................
First-line supervisors/managers of retail sales
workers .................................................................
Automotive service technicians and mechanics .....
Landscaping and groundskeeping workers ............
Cashiers .................................................................
Combined food preparation and serving workers,
including fast food ................................................
Welders, cutters, solderers, and brazers ...............
Electricians .............................................................
Customer service representatives ..........................
Plumbers, pipefitters, and steamfitters ...................
Cooks, restaurant ...................................................
Security guards ......................................................
Home health aides .................................................
Food preparation workers ......................................
Waiters and waitresses ..........................................
Industrial machinery mechanics .............................
Service providing
Total
goods
producing
Private
industry
–
–
1 Days-away-from-work cases include those that resulted in days away from work, some of which also
included job transfer or restriction.
2 Excludes farms with fewer than 11 employees.
3 Data for Mining (Sector 21 in the North American Industry Classification System-- United States,
2002) include establishments not governed by the Mine Safety and Health Administration rules and
reporting, such as those in Oil and Gas Extraction and related support activities. Data for mining operators
in coal, metal, and nonmetal mining are provided to BLS by the Mine Safety and Health Administration,
U.S. Department of Labor. Independent mining contractors are excluded from the coal, metal, and
nonmetal mining industries. These data do not reflect the changes the Occupational Safety and Health
60
40
50
830
–
–
40
–
–
–
70
20
2,230
30
–
420
–
20
40
330
Administration made to its recordkeeping requirements effective January 1, 2002; therefore, estimates for
these industries are not comparable to estimates in other industries.
4 Data for employers in rail transportation are provided to BLS by the Federal Railroad Administration,
U.S. Department of Transportation.
NOTE: Dash indicates data do not meet publication guidelines. Because of rounding and data
exclusion of nonclassifiable responses, data may not sum to the totals.
SOURCE: Bureau of Labor Statistics, U.S. Department of Labor, Survey of Occupational Injuries and
Illnesses in cooperation with participating State agencies
11
TABLE 5. Number of nonfatal occupational injuries and illnesses involving days away from work1 by selected injury or illness characteristics and major industry sector, 2008
Goods producing
Characteristic
Service providing
Total
goods
producing
Natural
resources
and
mining2,3
Construction
Manufacturing
Total
service
providing
Trade,
transportation and
utilities4
Information
Financial
activities
Professional
and
business
services
Education
and
health
services
Leisure
and
hospitality
Other
services
311,890
26,710
120,240
164,940
766,250
328,220
18,070
35,010
85,540
182,750
86,190
30,470
416,620
93,650
87,060
12,760
89,650
15,630
10,080
4,100
5,620
6,230
43,960
103,860
24,110
33,500
6,920
31,540
4,220
4,220
1,390
2,350
3,780
12,070
8,470
2,760
2,330
420
3,460
220
80
50
190
490
1,090
39,920
7,870
13,280
3,880
13,470
1,070
410
220
690
570
4,770
55,470
13,470
17,880
2,620
14,610
2,920
3,740
1,120
1,480
2,720
6,220
312,760
69,540
53,570
5,840
58,110
11,410
5,860
2,720
3,270
2,450
31,890
135,720
31,850
25,290
3,070
25,470
3,750
1,510
990
1,080
1,330
12,500
7,650
1,260
860
70
1,370
60
380
110
20
80
1,100
12,400
3,040
1,810
150
4,090
210
1,150
80
80
170
1,610
30,120
6,700
6,400
800
7,910
400
700
310
620
360
4,390
89,010
17,040
4,670
1,120
10,780
1,440
870
790
480
110
7,340
28,230
7,380
11,300
460
6,240
4,720
680
400
650
360
3,550
9,630
2,270
3,240
170
2,240
830
570
40
330
30
1,410
73,270
27,450
15,890
366,710
74,100
222,290
244,150
48,420
46,660
41,940
95,080
240,760
91,830
55,270
38,690
10,700
15,860
112,200
24,760
13,450
3,580
96,840
19,840
54,340
88,200
14,410
14,090
14,950
40,400
68,570
25,000
14,380
12,200
3,530
3,580
24,610
2,260
1,010
400
7,380
1,460
3,990
6,720
1,270
610
1,020
3,320
6,980
2,420
1,270
980
320
330
2,480
9,980
5,510
1,510
38,210
5,950
23,640
27,430
4,630
3,980
5,670
11,910
30,580
11,360
7,060
5,360
1,320
1,590
10,380
12,520
6,930
1,670
51,250
12,430
26,700
54,050
8,500
9,500
8,270
25,170
31,010
11,220
6,050
5,850
1,890
1,660
11,760
48,510
14,000
12,310
269,870
54,270
167,950
155,960
34,010
32,570
26,990
54,680
172,190
66,830
40,880
26,490
7,180
12,290
87,590
21,230
6,240
5,280
119,060
25,950
71,040
66,490
15,930
12,220
11,360
24,050
77,620
28,070
16,820
13,640
4,010
3,370
32,230
850
250
340
5,690
1,410
3,480
3,480
760
920
570
990
4,790
2,020
1,290
630
80
270
2,490
2,300
800
610
12,490
2,160
7,330
6,410
1,360
2,020
560
2,160
6,940
2,530
1,560
1,540
670
1,180
4,470
6,060
1,540
1,380
25,140
4,490
15,340
17,970
3,590
3,580
3,060
6,710
20,610
7,910
5,200
3,010
430
2,270
10,890
9,170
2,640
3,750
72,440
12,670
49,610
28,860
7,550
7,630
4,090
7,560
36,950
16,480
9,350
4,070
1,220
3,280
26,610
5,430
1,460
590
25,150
5,630
15,710
25,500
4,080
4,780
5,170
10,520
19,040
7,280
5,430
2,400
580
1,660
8,100
3,450
1,060
360
9,910
1,950
5,460
7,250
740
1,420
2,180
2,690
6,230
2,540
1,230
1,200
190
260
2,810
Private
industry
2,3,4
Total cases ..................................................... 1,078,140
Nature of injury or illness:
Sprains, strains, tears .................................
Bruises, contusions .....................................
Cuts, lacerations .........................................
Punctures ....................................................
Fractures .....................................................
Heat burns ..................................................
Carpal tunnel syndrome ..............................
Tendonitis ...................................................
Chemical burns ...........................................
Amputations ................................................
Multiple traumatic injuries ...........................
Part of body affected by the injury or
illness:
Head ...........................................................
Eye ............................................................
Neck ............................................................
Trunk ...........................................................
Shoulder ...................................................
Back ..........................................................
Upper extremities ........................................
Arm ...........................................................
Wrist ..........................................................
Hand, except finger ...................................
Finger ........................................................
Lower extremities ........................................
Knee .........................................................
Ankle .........................................................
Foot, except toe ........................................
Toe ............................................................
Body systems .............................................
Multiple parts ..............................................
See footnotes at end of table.
12
TABLE 5. Number of nonfatal occupational injuries and illnesses involving days away from work1 by selected injury or illness characteristics and major industry sector, 2008 —
Continued
Goods producing
Characteristic
Service providing
Total
goods
producing
Natural
resources
and
mining2,3
Construction
Manufacturing
Total
service
providing
Trade,
transportation and
utilities4
Information
Financial
activities
Professional
and
business
services
Education
and
health
services
Leisure
and
hospitality
Other
services
15,220
130,010
42,280
64,170
106,920
217,420
72,030
91,320
156,360
149,490
61,680
49,180
6,100
27,060
6,780
30,210
60,950
50,410
28,700
18,150
46,220
44,770
480
–
850
1,840
150
2,250
3,880
5,010
2,050
2,640
2,310
2,170
–
–
1,630
5,580
2,340
7,420
27,930
22,920
13,940
6,600
16,600
15,890
200
–
3,610
19,640
4,280
20,540
29,150
22,480
12,700
8,900
27,300
26,710
270
–
9,130
102,950
35,500
33,960
45,970
167,000
43,330
73,170
110,140
104,720
61,200
49,180
3,010
65,200
12,840
16,750
29,500
59,600
15,780
45,300
46,000
43,490
2,400
160
110
1,460
720
1,070
1,060
4,820
1,440
1,760
3,640
3,560
100
–
370
2,880
2,450
2,220
2,650
9,310
2,020
2,990
5,850
5,660
910
100
1,180
9,360
2,690
3,780
5,230
21,300
4,880
8,550
12,060
11,060
1,990
630
2,650
10,030
9,840
3,580
2,290
44,430
8,690
8,470
25,410
24,470
53,700
48,150
1,290
12,110
5,840
4,440
1,670
22,370
7,810
3,430
11,990
11,500
1,770
100
510
1,910
1,120
2,120
3,570
5,180
2,710
2,680
5,190
4,990
330
30
291,880
152,770
70,300
48,610
67,510
157,680
35,420
250,960
129,990
30,920
114,170
58,450
22,970
23,990
24,690
28,960
8,470
61,590
31,100
12,800
10,760
5,870
2,040
2,360
2,270
2,400
480
4,060
1,790
320
42,970
25,250
9,250
4,340
15,560
9,160
3,810
21,310
11,040
1,500
60,430
27,330
11,680
17,290
6,860
17,400
4,170
36,220
18,280
10,970
177,710
94,320
47,330
24,630
42,820
128,720
26,960
189,380
98,890
18,130
89,330
47,320
22,760
13,460
18,870
43,150
10,230
86,410
47,450
6,780
3,680
1,570
1,190
740
1,760
3,200
680
3,140
1,420
950
6,970
4,050
1,160
1,140
2,310
7,640
930
6,520
3,760
2,550
20,120
9,840
5,600
3,370
7,070
14,740
2,860
14,670
8,160
2,340
24,450
12,730
7,620
2,790
7,640
37,140
7,250
58,920
26,110
3,010
24,340
14,120
6,570
2,400
3,950
19,040
4,030
13,550
8,070
1,530
8,820
4,690
2,430
720
1,220
3,820
980
6,170
3,910
960
45,480
48,610
29,550
2,320
16,330
6,120
14,630
9,130
4,600
920
400
1,310
1,140
1,190
490
80
60
970
4,850
4,320
2,650
450
140
160
8,640
3,610
1,470
390
190
180
30,850
39,480
24,950
1,400
15,930
4,810
8,240
21,880
12,970
970
1,610
1,020
550
1,250
950
–
90
90
1,590
1,870
1,000
20
740
110
3,680
6,420
4,260
160
1,330
1,750
7,750
5,240
4,270
80
10,680
510
7,370
1,660
680
120
1,430
290
1,660
1,170
810
40
60
1,030
Private
industry
2,3,4
Source of injury or illness:
Chemicals and chemical products ..............
Containers ..................................................
Furniture and fixtures ..................................
Machinery ...................................................
Parts and materials .....................................
Floors, walkways, ground surfaces .............
Tools, instruments, and equipment .............
Vehicles ......................................................
Person, injured or ill worker ........................
Worker motion or position .........................
Person, other than injured or ill worker .......
Health care patient ....................................
Event or exposure leading to injury
or illness:
Contact with objects and equipment ...........
Struck by object ........................................
Struck against object ................................
Caught in equipment or object ..................
Fall to lower level ........................................
Fall on same level .......................................
Slip, trip, loss of balance without fall ...........
Overexertion ...............................................
Overexertion in lifting ................................
Repetitive motion ........................................
Exposure to harmful
substances ................................................
Transportation accidents ............................
Highway accident ......................................
Fires and explosions ...................................
Assaults and violent acts by person ...........
Assaults by animal ......................................
1 Days-away-from-work cases include those that resulted in days away from work, some of which
also included job transfer or restriction.
2 Excludes farms with fewer than 11 employees.
3 Data for Mining (Sector 21 in the North American Industry Classification System-- United States,
2002) include establishments not governed by the Mine Safety and Health Administration rules and
reporting, such as those in Oil and Gas Extraction and related support activities. Data for mining
operators in coal, metal, and nonmetal mining are provided to BLS by the Mine Safety and Health
Administration, U.S. Department of Labor. Independent mining contractors are excluded from the coal,
metal, and nonmetal mining industries. These data do not reflect the changes the Occupational Safety
and Health Administration made to its recordkeeping requirements effective January 1, 2002; therefore,
estimates for these industries are not comparable to estimates in other industries.
4 Data for employers in rail transportation are provided to BLS by the Federal Railroad
Administration, U.S. Department of Transportation.
NOTE: Dash indicates data do not meet publication guidelines. Because of rounding and data
exclusion of nonclassifiable responses, data may not sum to the totals.
SOURCE: Bureau of Labor Statistics, U.S. Department of Labor, Survey of Occupational Injuries and
Illnesses in cooperation with participating State agencies
13
TABLE 6. Percent distribution of nonfatal occupational injuries and illnesses involving days away from work1 by selected injury or illness characteristics and major industry
sector, 2008
Goods producing
Service providing
Characteristic
Private
industry 2,3,4
Total
goods
producing
Natural
resources
and
mining2,3
Construction
Manufacturing
Total
service
providing
Trade,
transportation and
utilities4
Information
Financial
activities
Professional
and
business
services
Education
and
health
services
Leisure
and
hospitality
Other
services
Total [1,078,140 cases] ..................................
100.0
100.0
100.0
100.0
100.0
100.0
100.0
100.0
100.0
100.0
100.0
100.0
100.0
38.6
8.7
8.1
1.2
8.3
1.4
.9
.4
.5
.6
4.1
33.3
7.7
10.7
2.2
10.1
1.4
1.4
.4
.8
1.2
3.9
31.7
10.3
8.7
1.6
13.0
.8
.3
.2
.7
1.8
4.1
33.2
6.5
11.0
3.2
11.2
.9
.3
.2
.6
.5
4.0
33.6
8.2
10.8
1.6
8.9
1.8
2.3
.7
.9
1.6
3.8
40.8
9.1
7.0
.8
7.6
1.5
.8
.4
.4
.3
4.2
41.4
9.7
7.7
.9
7.8
1.1
.5
.3
.3
.4
3.8
42.3
7.0
4.8
.4
7.6
.3
2.1
.6
.1
.4
6.1
35.4
8.7
5.2
.4
11.7
.6
3.3
.2
.2
.5
4.6
35.2
7.8
7.5
.9
9.2
.5
.8
.4
.7
.4
5.1
48.7
9.3
2.6
.6
5.9
.8
.5
.4
.3
.1
4.0
32.8
8.6
13.1
.5
7.2
5.5
.8
.5
.8
.4
4.1
31.6
7.4
10.6
.6
7.4
2.7
1.9
.1
1.1
.1
4.6
6.8
2.5
1.5
34.0
6.9
20.6
22.6
4.5
4.3
3.9
8.8
22.3
8.5
5.1
3.6
1.0
1.5
10.4
7.9
4.3
1.1
31.0
6.4
17.4
28.3
4.6
4.5
4.8
13.0
22.0
8.0
4.6
3.9
1.1
1.1
7.9
8.5
3.8
1.5
27.6
5.5
14.9
25.2
4.8
2.3
3.8
12.4
26.1
9.1
4.8
3.7
1.2
1.2
9.3
8.3
4.6
1.3
31.8
4.9
19.7
22.8
3.9
3.3
4.7
9.9
25.4
9.4
5.9
4.5
1.1
1.3
8.6
7.6
4.2
1.0
31.1
7.5
16.2
32.8
5.2
5.8
5.0
15.3
18.8
6.8
3.7
3.5
1.1
1.0
7.1
6.3
1.8
1.6
35.2
7.1
21.9
20.4
4.4
4.3
3.5
7.1
22.5
8.7
5.3
3.5
.9
1.6
11.4
6.5
1.9
1.6
36.3
7.9
21.6
20.3
4.9
3.7
3.5
7.3
23.6
8.6
5.1
4.2
1.2
1.0
9.8
4.7
1.4
1.9
31.5
7.8
19.3
19.3
4.2
5.1
3.2
5.5
26.5
11.2
7.1
3.5
.4
1.5
13.8
6.6
2.3
1.7
35.7
6.2
20.9
18.3
3.9
5.8
1.6
6.2
19.8
7.2
4.5
4.4
1.9
3.4
12.8
7.1
1.8
1.6
29.4
5.2
17.9
21.0
4.2
4.2
3.6
7.8
24.1
9.2
6.1
3.5
.5
2.7
12.7
5.0
1.4
2.1
39.6
6.9
27.1
15.8
4.1
4.2
2.2
4.1
20.2
9.0
5.1
2.2
.7
1.8
14.6
6.3
1.7
.7
29.2
6.5
18.2
29.6
4.7
5.5
6.0
12.2
22.1
8.4
6.3
2.8
.7
1.9
9.4
11.3
3.5
1.2
32.5
6.4
17.9
23.8
2.4
4.7
7.2
8.8
20.4
8.3
4.0
3.9
.6
.9
9.2
Nature of injury or illness:
Sprains, strains, tears .................................
Bruises, contusions .....................................
Cuts, lacerations .........................................
Punctures ....................................................
Fractures .....................................................
Heat burns ..................................................
Carpal tunnel syndrome ..............................
Tendonitis ...................................................
Chemical burns ...........................................
Amputations ................................................
Multiple traumatic injuries ...........................
Part of body affected by the injury or
illness:
Head ...........................................................
Eye ............................................................
Neck ............................................................
Trunk ...........................................................
Shoulder ...................................................
Back ..........................................................
Upper extremities ........................................
Arm ...........................................................
Wrist ..........................................................
Hand, except finger ...................................
Finger ........................................................
Lower extremities ........................................
Knee .........................................................
Ankle .........................................................
Foot, except toe ........................................
Toe ............................................................
Body systems .............................................
Multiple parts ..............................................
See footnotes at end of table.
14
TABLE 6. Percent distribution of nonfatal occupational injuries and illnesses involving days away from work1 by selected injury or illness characteristics and major industry
sector, 2008 — Continued
Goods producing
Characteristic
Service providing
Private
industry 2,3,4
Total
goods
producing
Natural
resources
and
mining2,3
Construction
Manufacturing
Total
service
providing
Trade,
transportation and
utilities4
Information
Financial
activities
Professional
and
business
services
Education
and
health
services
Leisure
and
hospitality
Other
services
1.4
12.1
3.9
6.0
9.9
20.2
6.7
8.5
14.5
13.9
5.7
4.6
2.0
8.7
2.2
9.7
19.5
16.2
9.2
5.8
14.8
14.4
.2
–
3.2
6.9
.6
8.4
14.5
18.8
7.7
9.9
8.6
8.1
–
–
1.4
4.6
1.9
6.2
23.2
19.1
11.6
5.5
13.8
13.2
.2
–
2.2
11.9
2.6
12.5
17.7
13.6
7.7
5.4
16.6
16.2
.2
–
1.2
13.4
4.6
4.4
6.0
21.8
5.7
9.5
14.4
13.7
8.0
6.4
0.9
19.9
3.9
5.1
9.0
18.2
4.8
13.8
14.0
13.3
.7
(5)
0.6
8.1
4.0
5.9
5.9
26.7
8.0
9.7
20.1
19.7
.6
–
1.1
8.2
7.0
6.3
7.6
26.6
5.8
8.5
16.7
16.2
2.6
.3
1.4
10.9
3.1
4.4
6.1
24.9
5.7
10.0
14.1
12.9
2.3
.7
1.5
5.5
5.4
2.0
1.3
24.3
4.8
4.6
13.9
13.4
29.4
26.3
1.5
14.1
6.8
5.2
1.9
26.0
9.1
4.0
13.9
13.3
2.1
.1
1.7
6.3
3.7
7.0
11.7
17.0
8.9
8.8
17.0
16.4
1.1
.1
27.1
14.2
6.5
4.5
6.3
14.6
3.3
23.3
12.1
2.9
36.6
18.7
7.4
7.7
7.9
9.3
2.7
19.7
10.0
4.1
40.3
22.0
7.6
8.8
8.5
9.0
1.8
15.2
6.7
1.2
35.7
21.0
7.7
3.6
12.9
7.6
3.2
17.7
9.2
1.2
36.6
16.6
7.1
10.5
4.2
10.5
2.5
22.0
11.1
6.7
23.2
12.3
6.2
3.2
5.6
16.8
3.5
24.7
12.9
2.4
27.2
14.4
6.9
4.1
5.7
13.1
3.1
26.3
14.5
2.1
20.4
8.7
6.6
4.1
9.7
17.7
3.8
17.4
7.9
5.3
19.9
11.6
3.3
3.3
6.6
21.8
2.7
18.6
10.7
7.3
23.5
11.5
6.5
3.9
8.3
17.2
3.3
17.1
9.5
2.7
13.4
7.0
4.2
1.5
4.2
20.3
4.0
32.2
14.3
1.6
28.2
16.4
7.6
2.8
4.6
22.1
4.7
15.7
9.4
1.8
28.9
15.4
8.0
2.4
4.0
12.5
3.2
20.2
12.8
3.2
4.2
4.5
2.7
.2
1.5
.6
4.7
2.9
1.5
.3
.1
.4
4.3
4.5
1.8
.3
.2
3.6
4.0
3.6
2.2
.4
.1
.1
5.2
2.2
.9
.2
.1
.1
4.0
5.2
3.3
.2
2.1
.6
2.5
6.7
4.0
.3
.5
.3
3.0
6.9
5.3
–
.5
.5
4.5
5.3
2.9
.1
2.1
.3
4.3
7.5
5.0
.2
1.6
2.0
4.2
2.9
2.3
(5)
5.8
.3
8.6
1.9
.8
.1
1.7
.3
5.4
3.8
2.7
.1
.2
3.4
Source of injury or illness:
Chemicals and chemical products ..............
Containers ..................................................
Furniture and fixtures ..................................
Machinery ...................................................
Parts and materials .....................................
Floors, walkways, ground surfaces .............
Tools, instruments, and equipment .............
Vehicles ......................................................
Person, injured or ill worker ........................
Worker motion or position .........................
Person, other than injured or ill worker .......
Health care patient ....................................
Event or exposure leading to injury
or illness:
Contact with objects and equipment ...........
Struck by object ........................................
Struck against object ................................
Caught in equipment or object ..................
Fall to lower level ........................................
Fall on same level .......................................
Slip, trip, loss of balance without fall ...........
Overexertion ...............................................
Overexertion in lifting ................................
Repetitive motion ........................................
Exposure to harmful
substances ................................................
Transportation accidents ............................
Highway accident ......................................
Fires and explosions ...................................
Assaults and violent acts by person ...........
Assaults by animal ......................................
1 Days-away-from-work cases include those that resulted in days away from work, some of which
also included job transfer or restriction.
2 Excludes farms with fewer than 11 employees.
3 Data for Mining (Sector 21 in the North American Industry Classification System-- United States,
2002) include establishments not governed by the Mine Safety and Health Administration rules and
reporting, such as those in Oil and Gas Extraction and related support activities. Data for mining
operators in coal, metal, and nonmetal mining are provided to BLS by the Mine Safety and Health
Administration, U.S. Department of Labor. Independent mining contractors are excluded from the coal,
metal, and nonmetal mining industries. These data do not reflect the changes the Occupational Safety
and Health Administration made to its recordkeeping requirements effective January 1, 2002; therefore,
estimates for these industries are not comparable to estimates in other industries.
4 Data for employers in rail transportation are provided to BLS by the Federal Railroad
Administration, U.S. Department of Transportation.
5 Data too small to be displayed.
NOTE: Dash indicates data do not meet publication guidelines. Because of rounding and data
exclusion of nonclassifiable responses, percentages may not add to 100.
SOURCE: Bureau of Labor Statistics, U.S. Department of Labor, Survey of Occupational Injuries and
Illnesses in cooperation with participating State agencies
15
TABLE 7. Incidence rates1 for nonfatal occupational injuries and illnesses involving days away from work2 per 10,000 full-time workers for selected characteristics and major
industry sector, 2008
Goods producing
Characteristic
Total [1,078,140 cases] .................................
Service providing
3,4,5
Total
goods
producing
Natural
resources
and
mining3,4
Construction
Manufacturing
Total
service
providing
Trade,
transportation and
utilities5
Information
Financial
activities
Professional
and
business
services
Education
and
health
services
Leisure
and
hospitality
Other
services
113.3
140.0
155.9
174.3
120.7
105.1
143.6
69.4
47.2
61.2
131.4
95.7
98.2
43.8
9.8
9.1
1.3
9.4
1.6
1.1
.4
.6
.7
4.6
46.6
10.8
15.0
3.1
14.2
1.9
1.9
.6
1.1
1.7
5.4
49.4
16.1
13.6
2.5
20.2
1.3
.5
.3
1.1
2.9
6.4
57.9
11.4
19.3
5.6
19.5
1.6
.6
.3
1.0
.8
6.9
40.6
9.9
13.1
1.9
10.7
2.1
2.7
.8
1.1
2.0
4.5
42.9
9.5
7.4
.8
8.0
1.6
.8
.4
.4
.3
4.4
59.4
13.9
11.1
1.3
11.1
1.6
.7
.4
.5
.6
5.5
29.4
4.8
3.3
.3
5.3
.2
1.5
.4
.1
.3
4.2
16.7
4.1
2.4
.2
5.5
.3
1.6
.1
.1
.2
2.2
21.5
4.8
4.6
.6
5.7
.3
.5
.2
.4
.3
3.1
64.0
12.2
3.4
.8
7.8
1.0
.6
.6
.3
.1
5.3
31.4
8.2
12.6
.5
6.9
5.2
.8
.4
.7
.4
3.9
31.0
7.3
10.4
.5
7.2
2.7
1.8
.1
1.1
.1
4.5
7.7
2.9
1.7
38.5
7.8
23.4
25.7
5.1
4.9
4.4
10.0
25.3
9.7
5.8
4.1
1.1
1.7
11.8
11.1
6.0
1.6
43.5
8.9
24.4
39.6
6.5
6.3
6.7
18.1
30.8
11.2
6.5
5.5
1.6
1.6
11.0
13.2
5.9
2.3
43.1
8.5
23.3
39.2
7.4
3.5
5.9
19.4
40.7
14.1
7.4
5.7
1.9
1.9
14.5
14.5
8.0
2.2
55.4
8.6
34.3
39.8
6.7
5.8
8.2
17.3
44.3
16.5
10.2
7.8
1.9
2.3
15.0
9.2
5.1
1.2
37.5
9.1
19.5
39.5
6.2
7.0
6.0
18.4
22.7
8.2
4.4
4.3
1.4
1.2
8.6
6.7
1.9
1.7
37.0
7.4
23.0
21.4
4.7
4.5
3.7
7.5
23.6
9.2
5.6
3.6
1.0
1.7
12.0
9.3
2.7
2.3
52.1
11.4
31.1
29.1
7.0
5.3
5.0
10.5
34.0
12.3
7.4
6.0
1.8
1.5
14.1
3.3
1.0
1.3
21.8
5.4
13.4
13.4
2.9
3.5
2.2
3.8
18.4
7.8
5.0
2.4
.3
1.0
9.6
3.1
1.1
.8
16.8
2.9
9.9
8.6
1.8
2.7
.8
2.9
9.4
3.4
2.1
2.1
.9
1.6
6.0
4.3
1.1
1.0
18.0
3.2
11.0
12.8
2.6
2.6
2.2
4.8
14.7
5.7
3.7
2.2
.3
1.6
7.8
6.6
1.9
2.7
52.1
9.1
35.7
20.7
5.4
5.5
2.9
5.4
26.6
11.8
6.7
2.9
.9
2.4
19.1
6.0
1.6
.7
27.9
6.3
17.4
28.3
4.5
5.3
5.7
11.7
21.1
8.1
6.0
2.7
.6
1.8
9.0
11.1
3.4
1.1
31.9
6.3
17.6
23.4
2.4
4.6
7.0
8.7
20.1
8.2
4.0
3.9
.6
.9
9.1
Private
industry
Nature of injury or illness:
Sprains, strains, tears .................................
Bruises, contusions .....................................
Cuts, lacerations .........................................
Punctures ....................................................
Fractures .....................................................
Heat burns ..................................................
Carpal tunnel syndrome ..............................
Tendonitis ...................................................
Chemical burns ...........................................
Amputations ................................................
Multiple traumatic injuries ...........................
Part of body affected by the injury or
illness:
Head ...........................................................
Eye ............................................................
Neck ............................................................
Trunk ...........................................................
Shoulder ...................................................
Back ..........................................................
Upper extremities ........................................
Arm ...........................................................
Wrist ..........................................................
Hand, except finger ...................................
Finger ........................................................
Lower extremities ........................................
Knee .........................................................
Ankle .........................................................
Foot, except toe ........................................
Toe ............................................................
Body systems .............................................
Multiple parts ..............................................
See footnotes at end of table.
16
TABLE 7. Incidence rates1 for nonfatal occupational injuries and illnesses involving days away from work2 per 10,000 full-time workers for selected characteristics and major
industry sector, 2008 — Continued
Goods producing
Total
goods
producing
Natural
resources
and
mining3,4
Construction
Manufacturing
Total
service
providing
Trade,
transportation and
utilities5
Information
Financial
activities
Professional
and
business
services
Education
and
health
services
Leisure
and
hospitality
Other
services
1.6
13.7
4.4
6.7
11.2
22.8
7.6
9.6
16.4
15.7
6.5
5.2
2.7
12.1
3.0
13.6
27.4
22.6
12.9
8.1
20.7
20.1
.2
–
5.0
10.7
.9
13.1
22.6
29.2
12.0
15.4
13.5
12.7
–
–
2.4
8.1
3.4
10.8
40.5
33.2
20.2
9.6
24.1
23.0
.3
–
2.6
14.4
3.1
15.0
21.3
16.4
9.3
6.5
20.0
19.5
.2
–
1.3
14.1
4.9
4.7
6.3
22.9
5.9
10.0
15.1
14.4
8.4
6.7
1.3
28.5
5.6
7.3
12.9
26.1
6.9
19.8
20.1
19.0
1.1
.1
0.4
5.6
2.7
4.1
4.1
18.5
5.5
6.7
14.0
13.7
.4
–
0.5
3.9
3.3
3.0
3.6
12.5
2.7
4.0
7.9
7.6
1.2
.1
0.8
6.7
1.9
2.7
3.7
15.2
3.5
6.1
8.6
7.9
1.4
.5
1.9
7.2
7.1
2.6
1.6
31.9
6.2
6.1
18.3
17.6
38.6
34.6
1.4
13.4
6.5
4.9
1.9
24.8
8.7
3.8
13.3
12.8
2.0
.1
1.7
6.1
3.6
6.8
11.5
16.7
8.7
8.6
16.7
16.1
1.1
.1
30.7
16.1
7.4
5.1
7.1
16.6
3.7
26.4
13.7
3.2
51.2
26.2
10.3
10.8
11.1
13.0
3.8
27.6
14.0
5.7
62.8
34.3
11.9
13.8
13.2
14.0
2.8
23.7
10.4
1.9
62.3
36.6
13.4
6.3
22.6
13.3
5.5
30.9
16.0
2.2
44.2
20.0
8.5
12.6
5.0
12.7
3.1
26.5
13.4
8.0
24.4
12.9
6.5
3.4
5.9
17.7
3.7
26.0
13.6
2.5
39.1
20.7
10.0
5.9
8.3
18.9
4.5
37.8
20.8
3.0
14.1
6.0
4.6
2.9
6.7
12.3
2.6
12.0
5.5
3.6
9.4
5.5
1.6
1.5
3.1
10.3
1.3
8.8
5.1
3.4
14.4
7.0
4.0
2.4
5.1
10.5
2.0
10.5
5.8
1.7
17.6
9.2
5.5
2.0
5.5
26.7
5.2
42.4
18.8
2.2
27.0
15.7
7.3
2.7
4.4
21.1
4.5
15.0
9.0
1.7
28.4
15.1
7.8
2.3
3.9
12.3
3.2
19.9
12.6
3.1
4.8
5.1
3.1
.2
1.7
.6
6.6
4.1
2.1
.4
.2
.6
6.6
7.0
2.8
.5
.4
5.7
7.0
6.3
3.8
.6
.2
.2
6.3
2.6
1.1
.3
.1
.1
4.2
5.4
3.4
.2
2.2
.7
3.6
9.6
5.7
.4
.7
.4
2.1
4.8
3.7
–
.3
.4
2.1
2.5
1.3
(6)
1.0
.2
2.6
4.6
3.0
.1
1.0
1.2
5.6
3.8
3.1
.1
7.7
.4
8.2
1.8
.8
.1
1.6
.3
5.3
3.8
2.6
.1
.2
3.3
Private
industry
Characteristic
Service providing
3,4,5
Source of injury or illness:
Chemicals and chemical products ..............
Containers ..................................................
Furniture and fixtures ..................................
Machinery ...................................................
Parts and materials .....................................
Floors, walkways, ground surfaces .............
Tools, instruments, and equipment .............
Vehicles ......................................................
Person, injured or ill worker ........................
Worker motion or position .........................
Person, other than injured or ill worker .......
Health care patient ....................................
Event or exposure leading to injury
or illness:
Contact with objects and equipment ...........
Struck by object ........................................
Struck against object ................................
Caught in equipment or object ..................
Fall to lower level ........................................
Fall on same level .......................................
Slip, trip, loss of balance without fall ...........
Overexertion ...............................................
Overexertion in lifting ................................
Repetitive motion ........................................
Exposure to harmful
substances ................................................
Transportation accidents ............................
Highway accident ......................................
Fires and explosions ...................................
Assaults and violent acts by person ...........
Assaults by animal ......................................
1 Incidence rates represent the number of injuries and illnesses per 10,000 full-time workers and
were calculated as: (N/EH) x 20,000,000 where
N
EH
= number of injuries and illnesses
= total hours worked by all employees
during the calendar year
20,000,000
= base for
(working
year)
10,000 equivalent full-time workers
40
hours
per
week,
50
weeks
2002) include establishments not governed by the Mine Safety and Health Administration rules and
reporting, such as those in Oil and Gas Extraction and related support activities. Data for mining
operators in coal, metal, and nonmetal mining are provided to BLS by the Mine Safety and Health
Administration, U.S. Department of Labor. Independent mining contractors are excluded from the coal,
metal, and nonmetal mining industries. These data do not reflect the changes the Occupational Safety
and Health Administration made to its recordkeeping requirements effective January 1, 2002; therefore,
estimates for these industries are not comparable to estimates in other industries.
5 Data for employers in rail transportation are provided to BLS by the Federal Railroad
Administration, U.S. Department of Transportation.
6 Data too small to be displayed.
per
2 Days-away-from-work cases include those that resulted in days away from work, some of which
also included job transfer or restriction.
3 Excludes farms with fewer than 11 employees.
4 Data for Mining (Sector 21 in the North American Industry Classification System-- United States,
NOTE: Dash indicates data do not meet publication guidelines.
SOURCE: Bureau of Labor Statistics, U.S. Department of Labor, Survey of Occupational Injuries and
Illnesses in cooperation with participating State agencies
17
TABLE 8. Percent distribution of nonfatal occupational injuries and illnesses involving days away from work1 by selected worker
characteristics and number of days away from work, 2008
Percent of days-away-from-work cases involving —
Characteristic
Total [1,078,140 cases] ..........................
Median
31 days or days away
from work
more
Total
cases
1 day
2 days
100.0
14.9
11.0
17.8
11.9
11.7
6.8
26.0
8
100.0
100.0
14.6
15.5
10.5
11.9
17.1
19.1
11.7
12.2
11.9
11.4
7.0
6.5
27.3
23.4
9
7
100.0
100.0
100.0
100.0
100.0
100.0
100.0
100.0
–
20.1
20.3
17.5
14.0
13.1
11.1
8.8
38.5
17.9
13.2
12.4
10.4
9.5
9.4
8.1
–
21.1
20.7
19.9
17.3
16.7
15.1
14.2
30.8
12.5
12.3
11.6
12.2
11.6
11.6
11.9
15.4
11.2
11.7
11.5
11.5
11.6
12.3
13.2
–
4.8
5.5
6.2
7.0
7.4
7.6
8.3
–
12.4
16.2
20.9
27.6
30.1
32.9
35.6
4
4
5
6
9
10
12
15
100.0
100.0
100.0
100.0
16.9
16.7
15.0
12.7
11.8
12.1
11.5
9.5
20.2
19.0
18.5
15.7
12.7
12.3
11.8
11.5
11.6
11.0
11.5
12.4
5.7
6.2
6.9
7.5
21.1
22.7
25.0
30.7
6
6
7
11
100.0
100.0
100.0
100.0
16.3
16.9
14.4
16.6
11.5
12.1
11.3
12.1
17.8
18.5
18.2
16.3
11.5
11.7
12.4
15.3
11.2
11.1
11.3
11.3
7.3
5.6
7.1
5.4
24.4
24.1
25.3
23.0
7
6
7
7
100.0
15.1
10.6
20.5
15.8
11.3
5.1
21.6
6
100.0
100.0
100.0
100.0
13.7
14.0
10.5
12.7
16.1
4.3
13.2
9.9
21.7
7.5
15.8
17.6
10.4
54.8
10.5
11.9
9.7
2.2
11.8
12.7
5.4
7.5
5.3
6.3
22.9
9.7
35.5
28.9
5
10
11
10
3 - 5 days 6 - 10 days
11 - 20
days
21 - 30
days
Gender:
Male .....................................................
Female .................................................
Age:2
14 - 15 .................................................
16 - 19 .................................................
20 - 24 .................................................
25 - 34 .................................................
35 - 44 .................................................
45 - 54 .................................................
55 - 64 .................................................
65 and over ..........................................
Length of service with employer:
Less than 3 months .............................
3 - 11 months .......................................
1 - 5 years ............................................
More than 5 years ................................
Race or ethnic origin:
White only ............................................
Black only ............................................
Hispanic or Latino only ........................
Asian only ............................................
Native Hawaiian or Pacific Islander
only ....................................................
American Indian or Alaskan Native
only ....................................................
Hispanic or Latino and other race ........
Multi-race .............................................
Not reported .........................................
1 Days-away-from-work cases include those that resulted in days away
from work, some of which also included job transfer or restriction.
2 Information is not shown separately for injured workers under age 14;
they accounted for fewer than 50 cases.
NOTE:
Because of rounding and data exclusion of nonclassifiable responses, data
may not sum to the totals.
SOURCE: Bureau of Labor Statistics, U.S. Department of Labor, Survey
of Occupational Injuries and Illnesses in cooperation with participating State
agencies
Dash indicates data do not meet publication guidelines.
18
TABLE 9. Percent distribution of nonfatal occupational injuries and illnesses involving days away from work1 by major occupational
group and number of days away from work, 2008
Percent of days-away-from-work cases involving —
Occupation
Total
cases
1 day
2 days
3 - 5 days 6 - 10 days
11 - 20
days
21 - 30
days
Median
31 days or days away
from work
more
Total [1,078,140 cases] .........................................
100.0
14.9
11.0
17.8
11.9
11.7
6.8
26.0
8
Management occupations ....................................
Business and financial operations occupations ...
Computer and mathematical occupations ............
Architecture and engineering occupations ...........
Life, physical, and social science occupations .....
Community and social services occupations .......
Legal occupations ................................................
Education, training, and library occupations ........
Arts, design, entertainment, sports, and media
occupations ........................................................
Healthcare practitioners and technical
occupations ........................................................
Healthcare support occupations ...........................
Protective service occupations .............................
Food preparation and serving related
occupations ........................................................
Building and grounds cleaning and maintenance
occupations ........................................................
Personal care and service occupations ...............
Sales and related occupations .............................
Office and administrative support occupations ....
Farming, fishing, and forestry occupations ..........
Construction and extraction occupations .............
Installation, maintenance, and repair occupations
Production occupations ........................................
Transportation and material moving occupations
100.0
100.0
100.0
100.0
100.0
100.0
100.0
100.0
16.3
18.6
10.4
26.0
24.3
17.9
44.5
23.5
13.2
15.9
10.4
12.2
9.3
11.9
3.4
10.9
23.5
18.9
22.6
18.2
16.8
26.6
26.0
28.8
10.8
8.3
19.8
8.6
11.1
11.5
7.5
10.1
11.3
9.9
14.9
10.0
6.6
10.5
3.4
5.9
6.7
7.1
7.9
5.8
16.8
3.9
1.4
7.2
18.1
21.3
14.0
19.2
15.0
17.9
14.4
13.8
5
5
7
3
5
4
4
3
100.0
9.1
10.6
16.1
13.3
9.8
9.0
31.9
11
100.0
100.0
100.0
17.1
15.4
12.4
13.1
13.2
10.4
21.3
20.8
16.6
12.4
14.5
11.0
10.6
10.4
14.7
5.5
5.5
6.4
20.1
20.1
28.5
5
6
10
100.0
17.6
13.5
18.2
12.5
14.3
5.5
18.3
6
100.0
100.0
100.0
100.0
100.0
100.0
100.0
100.0
100.0
14.9
11.3
13.2
15.7
14.4
14.6
15.4
16.0
12.2
10.5
9.5
11.4
11.0
14.7
9.4
12.1
11.0
9.1
19.3
18.0
18.8
17.5
19.5
16.8
15.7
16.1
16.6
13.2
12.4
12.4
12.4
16.1
10.7
11.4
10.9
11.4
11.8
12.6
11.1
12.2
8.6
11.1
11.4
12.7
11.8
6.8
9.9
6.8
7.3
6.5
6.4
7.6
7.2
7.0
23.4
26.4
26.3
23.9
20.2
31.0
26.4
26.1
32.0
7
10
7
7
6
10
8
8
11
1 Days-away-from-work cases include those that resulted in days away from
work, some of which also included job transfer or restriction.
the totals.
SOURCE: Bureau of Labor Statistics, U.S. Department of Labor, Survey of
Occupational Injuries and Illnesses in cooperation with participating State
agencies
NOTE: Dash indicates data do not meet publication guidelines. Because of
rounding and data exclusion of nonclassifiable responses, data may not sum to
19
TABLE 10. Percent distribution of nonfatal occupational injuries and illnesses involving days away from work1 by selected occupation
and number of days away from work, 2008
Percent of days-away-from-work cases involving —
Occupation
Total [1,078,140 cases] .........................................
Laborers and freight, stock, and material movers,
hand .....................................................................
Truck drivers, heavy and tractor-trailer ..................
Nursing aides, orderlies, and attendants ................
Construction laborers .............................................
Retail salespersons ................................................
Janitors and cleaners, except maids and
housekeeping cleaners ........................................
Truck drivers, light or delivery services ..................
Maintenance and repair workers, general ..............
Registered nurses ..................................................
Maids and housekeeping cleaners .........................
Carpenters .............................................................
Stock clerks and order fillers ..................................
First-line supervisors/managers of retail sales
workers .................................................................
Automotive service technicians and mechanics .....
Landscaping and groundskeeping workers ............
Cashiers .................................................................
Combined food preparation and serving workers,
including fast food ................................................
Welders, cutters, solderers, and brazers ...............
Electricians .............................................................
Customer service representatives ..........................
Plumbers, pipefitters, and steamfitters ...................
Cooks, restaurant ...................................................
Security guards ......................................................
Home health aides .................................................
Food preparation workers ......................................
Waiters and waitresses ..........................................
Industrial machinery mechanics .............................
Median
31 days or days away
from work
more
Total
cases
1 day
2 days
100.0
14.9
11.0
17.8
11.9
11.7
6.8
26.0
8
100.0
100.0
100.0
100.0
100.0
15.4
9.0
15.3
13.8
12.5
10.2
6.8
13.9
9.5
11.1
18.1
14.8
22.7
16.9
19.8
11.3
11.6
14.7
13.2
12.5
11.7
11.2
10.3
11.9
11.3
7.2
7.2
5.3
6.6
6.9
26.1
39.4
17.9
28.0
25.8
8
17
5
9
8
100.0
100.0
100.0
100.0
100.0
100.0
100.0
15.4
9.2
15.6
15.8
13.7
14.0
16.4
11.1
8.1
13.7
11.7
10.9
11.2
11.5
18.7
16.0
16.6
22.3
22.2
15.5
19.0
12.8
12.5
9.6
12.3
12.9
10.8
13.3
11.7
11.5
11.3
11.2
10.5
10.0
10.4
6.0
7.3
6.0
6.3
6.8
5.9
6.6
24.4
35.3
27.1
20.2
23.1
32.5
23.0
7
13
7
6
7
10
7
100.0
100.0
100.0
100.0
10.1
20.8
11.9
14.5
13.1
15.3
8.4
12.5
20.1
15.4
17.9
18.2
12.5
12.0
13.8
14.1
8.6
7.3
13.3
14.8
6.5
10.1
10.9
5.7
29.3
19.1
23.8
20.1
7
5
10
7
100.0
100.0
100.0
100.0
100.0
100.0
100.0
100.0
100.0
100.0
100.0
16.5
18.8
17.7
17.6
16.0
17.2
13.4
8.1
22.4
20.6
13.0
14.9
13.2
8.0
8.8
9.6
11.9
10.5
8.1
11.6
9.5
10.4
20.1
16.3
14.9
15.0
18.9
24.0
16.2
17.7
19.6
14.1
11.0
8.3
9.2
6.9
10.5
8.9
17.0
10.9
15.3
13.4
13.3
8.4
16.6
10.1
10.5
14.9
14.2
16.5
16.9
10.6
15.0
10.3
12.1
5.0
6.9
8.0
5.5
6.5
4.0
6.3
8.5
3.8
10.5
13.9
18.5
25.5
33.7
27.7
26.0
9.3
25.9
31.8
14.2
21.7
31.1
5
6
13
9
10
5
10
11
5
7
15
1 Days-away-from-work cases include those that resulted in days away from
work, some of which also included job transfer or restriction.
3 - 5 days 6 - 10 days
11 - 20
days
21 - 30
days
the totals.
SOURCE: Bureau of Labor Statistics, U.S. Department of Labor, Survey of
Occupational Injuries and Illnesses in cooperation with participating State
agencies
NOTE: Dash indicates data do not meet publication guidelines. Because of
rounding and data exclusion of nonclassifiable responses, data may not sum to
20
TABLE 11. Percent distribution of nonfatal occupational injuries and illnesses involving days away from work1 by selected injury or
illness characteristics and number of days away from work, 2008
Percent of days-away-from-work cases involving —
Characteristic
Total [1,078,140 cases] .........................................
Median
31 days or days away
from work
more
Total
cases
1 day
2 days
100.0
14.9
11.0
17.8
11.9
11.7
6.8
26.0
8
100.0
100.0
100.0
100.0
100.0
100.0
100.0
100.0
100.0
100.0
100.0
11.9
21.1
26.2
26.1
5.7
17.8
3.4
6.8
29.2
5.1
12.9
10.3
15.1
16.1
15.7
5.1
13.7
3.1
7.3
14.6
3.5
11.3
18.6
22.1
19.1
20.4
10.7
17.6
7.7
18.3
22.2
10.8
15.9
13.3
12.3
12.0
14.3
8.9
16.3
10.2
16.1
10.0
9.6
11.9
12.1
9.4
10.0
8.1
13.7
13.1
19.2
20.7
7.3
14.9
11.4
6.8
5.7
5.0
4.0
9.4
4.9
11.1
5.4
9.1
12.2
6.1
27.0
14.4
11.6
11.5
46.6
16.6
45.3
25.6
7.7
43.8
30.5
9
4
3
3
28
6
28
11
3
26
9
100.0
100.0
100.0
100.0
100.0
100.0
100.0
100.0
100.0
100.0
100.0
100.0
100.0
100.0
100.0
100.0
100.0
100.0
34.8
44.4
16.9
11.5
8.3
12.5
17.1
14.7
12.2
19.0
20.4
11.7
8.9
12.4
13.8
17.4
23.0
13.0
18.6
21.5
13.3
9.9
7.2
11.4
11.1
10.3
8.0
11.9
12.9
9.7
7.8
10.5
10.9
10.2
13.7
11.0
20.2
19.7
19.6
18.7
12.9
21.8
16.8
15.7
13.2
18.1
18.6
17.0
14.6
19.3
19.0
21.2
24.2
16.7
8.4
6.0
13.2
12.8
11.1
13.6
12.1
10.3
10.9
14.4
12.5
11.4
10.9
12.6
11.4
12.8
10.9
11.4
6.5
4.3
8.2
12.2
11.2
11.6
13.0
12.7
14.0
13.2
12.4
12.1
13.3
11.3
9.3
13.4
7.3
10.8
2.8
1.2
5.7
7.4
7.0
6.3
6.7
7.5
7.8
5.7
6.3
7.8
9.4
6.5
7.7
7.2
6.9
5.9
8.8
2.8
23.0
27.5
42.3
22.8
23.2
28.7
33.9
17.8
16.9
30.3
35.0
27.4
27.9
17.9
14.0
31.2
2
2
6
10
20
7
7
10
14
6
5
11
15
8
7
6
4
9
3 - 5 days 6 - 10 days
11 - 20
days
21 - 30
days
Nature of injury or illness:
Sprains, strains, tears ........................................
Bruises, contusions ............................................
Cuts, lacerations ................................................
Punctures ...........................................................
Fractures ............................................................
Heat burns ..........................................................
Carpal tunnel syndrome .....................................
Tendonitis ...........................................................
Chemical burns ..................................................
Amputations .......................................................
Multiple traumatic injuries ...................................
Part of body affected by the injury or
illness:
Head ...................................................................
Eye ...................................................................
Neck ...................................................................
Trunk ..................................................................
Shoulder ...........................................................
Back .................................................................
Upper extremities ...............................................
Arm ...................................................................
Wrist .................................................................
Hand, except finger ..........................................
Finger ...............................................................
Lower extremities ...............................................
Knee .................................................................
Ankle ................................................................
Foot, except toe ...............................................
Toe ...................................................................
Body systems .....................................................
Multiple parts ......................................................
See footnotes at end of table.
21
TABLE 11. Percent distribution of nonfatal occupational injuries and illnesses involving days away from work1 by selected injury or
illness characteristics and number of days away from work, 2008 — Continued
Percent of days-away-from-work cases involving —
Characteristic
Median
31 days or days away
from work
more
Total
cases
1 day
2 days
100.0
100.0
100.0
100.0
100.0
100.0
100.0
100.0
100.0
100.0
100.0
100.0
28.6
12.2
17.7
14.8
16.6
11.9
22.7
12.3
11.1
11.1
14.8
14.7
16.4
9.8
11.3
10.7
11.8
9.5
13.7
10.6
9.1
9.1
12.8
12.5
21.4
19.0
22.3
17.3
17.0
15.9
17.0
17.4
17.9
17.9
20.7
21.3
10.8
12.6
10.5
10.8
11.4
11.6
12.6
10.8
12.3
12.5
14.1
14.8
7.2
13.2
10.1
13.5
11.6
11.7
11.2
10.7
12.6
12.8
11.0
11.3
5.5
7.0
6.0
7.6
6.9
7.4
5.1
7.6
7.2
7.0
6.4
6.0
10.2
26.2
22.2
25.4
24.7
31.9
17.7
30.8
29.9
29.7
20.1
19.3
3
9
5
9
7
11
5
10
10
10
6
6
100.0
100.0
100.0
100.0
100.0
100.0
100.0
100.0
100.0
100.0
20.9
22.2
21.5
13.7
11.9
12.3
12.3
11.4
11.4
7.0
13.5
14.1
14.8
9.3
8.2
10.4
9.3
9.6
9.9
5.6
18.3
18.4
18.7
17.1
14.4
16.6
16.6
18.4
18.2
13.6
11.5
11.5
10.8
12.9
9.7
12.2
14.1
12.7
13.3
12.1
10.7
10.2
9.5
15.2
10.8
12.0
13.0
13.0
13.1
15.2
5.8
5.7
5.6
6.6
7.2
7.8
6.4
7.0
7.6
8.2
19.3
17.9
19.1
25.2
37.8
28.7
28.3
27.8
26.5
38.4
5
5
5
9
15
10
10
10
10
18
100.0
100.0
100.0
100.0
100.0
100.0
25.7
10.8
11.9
6.5
16.0
24.3
16.1
10.5
11.2
16.8
14.0
13.6
21.8
17.5
18.5
21.6
17.6
25.8
12.2
9.5
9.2
16.4
11.9
10.5
10.2
10.2
10.5
8.2
14.4
4.7
4.8
7.9
8.2
3.9
6.8
9.2
9.3
33.7
30.5
26.7
19.3
11.8
3
12
10
7
6
3
3 - 5 days 6 - 10 days
11 - 20
days
21 - 30
days
Source of injury or illness:
Chemicals and chemical products .....................
Containers ..........................................................
Furniture and fixtures .........................................
Machinery ...........................................................
Parts and materials ............................................
Floors, walkways, ground surfaces ....................
Tools, instruments, and equipment ....................
Vehicles ..............................................................
Person, injured or ill worker ................................
Worker motion or position ................................
Person, other than injured or ill worker ..............
Health care patient ...........................................
Event or exposure leading to injury or
illness:
Contact with objects and equipment ..................
Struck by object ................................................
Struck against object ........................................
Caught in equipment or object .........................
Fall to lower level ...............................................
Fall on same level ..............................................
Slip, trip, loss of balance without fall ..................
Overexertion .......................................................
Overexertion in lifting .......................................
Repetitive motion ...............................................
Exposure to harmful
substances .......................................................
Transportation accidents ....................................
Highway accident .............................................
Fires and explosions ..........................................
Assaults and violent acts by person ...................
Assaults by animal .............................................
1 Days-away-from-work cases include those that resulted in days away from
work, some of which also included job transfer or restriction.
the totals.
SOURCE: Bureau of Labor Statistics, U.S. Department of Labor, Survey of
Occupational Injuries and Illnesses in cooperation with participating State
agencies
NOTE: Dash indicates data do not meet publication guidelines. Because of
rounding and data exclusion of nonclassifiable responses, data may not sum to
22
TABLE 12. Percent distribution of nonfatal occupational injuries and illnesses involving days away from work1 by major
industry sector and number of days away from work, 2008
Percent of days-away-from-work cases involving —
Industry
Private industry2 [1,078,140 cases] ..............
Total
cases
1 day
2 days
100.0
14.9
100.0
100.0
100.0
100.0
100.0
100.0
100.0
100.0
100.0
100.0
100.0
100.0
21 - 30
days
Median
31 days or days away
from work
more
3 - 5 days
6 - 10
days
11 - 20
days
11.0
17.8
11.9
11.7
6.8
26.0
8
14.7
11.7
14.7
15.2
10.7
11.6
10.9
10.4
16.7
18.3
16.5
16.7
11.2
12.1
10.5
11.5
11.9
11.5
11.3
12.5
6.8
6.5
6.6
7.0
28.0
28.4
29.7
26.7
9
9
10
8
14.9
13.2
12.0
19.2
16.0
15.9
16.0
19.2
11.1
10.0
10.2
9.6
10.8
12.8
12.7
11.1
18.3
17.2
18.2
16.7
17.4
21.6
17.9
15.1
12.1
11.5
12.2
10.7
12.1
13.3
13.6
9.7
11.6
11.5
11.8
11.4
12.7
10.8
13.4
9.5
6.8
7.0
6.5
9.7
7.0
5.9
6.3
8.0
25.1
29.5
29.2
22.7
24.0
19.8
20.2
27.3
7
10
9
7
8
5
7
7
Goods producing:
Total goods producing .................................
Natural resources and mining2,3 ................
Construction ..............................................
Manufacturing ............................................
Service providing:
Total service providing ................................
Trade, transportation and utilities4 .............
Information ................................................
Financial activities .....................................
Professional and business services ..........
Education and health services ..................
Leisure and hospitality ...............................
Other services ...........................................
1 Days-away-from-work cases include those that resulted in days away
from work, some of which also included job transfer or restriction.
2 Excludes farms with fewer than 11 employees.
3 Data for Mining (Sector 21 in the North American Industry
Classification System-- United States, 2002) include establishments not
governed by the Mine Safety and Health Administration rules and
reporting, such as those in Oil and Gas Extraction and related support
activities. Data for mining operators in coal, metal, and nonmetal mining
are provided to BLS by the Mine Safety and Health Administration, U.S.
Department of Labor. Independent mining contractors are excluded from
the coal, metal, and nonmetal mining industries. These data do not reflect
the changes the Occupational Safety and Health Administration made to
its recordkeeping requirements effective January 1, 2002; therefore,
estimates for these industries are not comparable to estimates in other
industries.
4 Data for employers in rail transportation are provided to BLS by the
Federal Railroad Administration, U.S. Department of Transportation.
NOTE: Dash indicates data do not meet publication guidelines.
Because of rounding and data exclusion of nonclassifiable responses, data
may not sum to the totals.
SOURCE: Bureau of Labor Statistics, U.S. Department of Labor,
Survey of Occupational Injuries and Illnesses in cooperation with
participating State agencies
23
TABLE 13. Number of nonfatal occupational injuries and illnesses involving days away from work1 by time, hours on the job, day of week, and major industry sector, 2008
Goods producing
Characteristic
Service providing
Total
goods
producing
Natural
resources
and
mining2,3
Construction
Manufacturing
Total
service
providing
Trade,
transportation and
utilities4
Information
Financial
activities
Professional
and
business
services
Education
and
health
services
Leisure
and
hospitality
Other
services
311,890
26,710
120,240
164,940
766,250
328,220
18,070
35,010
85,540
182,750
86,190
30,470
32,870
106,040
310,050
243,940
107,290
58,480
219,470
8,810
33,570
97,800
69,520
21,780
12,170
68,240
760
2,960
7,990
5,650
2,090
930
6,330
500
10,030
44,730
31,350
4,100
620
28,890
7,550
20,580
45,080
32,520
15,600
10,610
33,010
24,060
72,470
212,250
174,430
85,510
46,300
151,230
12,540
33,600
88,270
74,900
37,220
20,070
61,620
750
1,290
5,530
4,260
1,940
950
3,350
290
2,210
11,110
8,330
2,620
750
9,710
2,650
7,400
24,520
19,940
6,600
3,920
20,500
5,490
20,440
50,200
41,370
22,800
11,360
31,090
2,160
5,430
21,960
17,960
12,200
8,650
17,830
180
2,110
10,670
7,660
2,130
590
7,130
7,910
84,480
103,190
218,650
171,750
150,910
74,560
19,210
6,360
920
240,200
1,460
20,050
27,730
61,330
48,020
45,530
25,760
6,100
1,270
90
74,540
40
1,480
1,530
4,160
3,040
2,690
2,040
730
190
20
10,790
330
6,450
10,520
24,030
18,810
18,580
10,130
1,570
250
20
29,550
1,090
12,120
15,680
33,140
26,170
24,260
13,590
3,800
830
60
34,200
6,450
64,430
75,460
157,320
123,730
105,380
48,800
13,100
5,090
830
165,660
1,390
26,460
34,160
66,970
51,820
45,870
23,130
5,950
2,100
490
69,890
210
1,610
1,750
3,650
2,660
2,650
1,660
330
90
–
3,460
540
3,170
2,600
6,060
5,000
4,820
2,320
480
150
20
9,840
840
6,360
6,550
17,090
14,720
11,140
4,680
1,710
580
–
21,870
2,520
17,590
17,960
37,490
29,790
26,720
11,120
3,850
1,660
300
33,760
410
7,220
8,550
20,440
15,160
9,740
4,150
540
420
–
19,540
540
2,030
3,880
5,630
4,580
4,440
1,740
240
80
–
7,310
63,560
199,540
195,470
187,700
183,070
166,080
82,720
8,570
63,870
58,840
59,980
58,020
46,490
16,120
1,290
4,970
4,320
4,230
4,770
4,920
2,210
2,480
25,720
22,230
23,790
23,290
17,480
5,230
4,790
33,180
32,280
31,960
29,960
24,090
8,680
54,990
135,670
136,630
127,720
125,050
119,600
66,600
22,450
56,670
60,920
53,570
55,110
51,600
27,900
920
3,590
3,340
3,520
2,870
2,500
1,340
1,080
5,690
6,360
6,310
6,420
6,480
2,660
3,940
17,520
16,680
16,920
13,740
12,370
4,380
14,720
32,710
30,970
30,110
29,490
27,820
16,930
10,970
12,180
12,890
12,220
11,510
14,790
11,620
900
7,310
5,470
5,070
5,910
4,040
1,760
Private
industry
2,3,4
Total ......................................................... 1,078,140
Time of event:
12:01 A.M. to 4:00 A.M. .......................
4:01 A.M. to 8:00 A.M. .........................
8:01 A.M. to 12:00 noon ......................
12:01 P.M. to 4:00 P.M. .......................
4:01 P.M. to 8:00 P.M. .........................
8:01 P.M. to 12:00 midnight .................
Not reported .........................................
Hours on the job before event
occurred:
Before shift began ...............................
Less than 1 hour ..................................
1 hour to less than 2 hours ..................
2 hours to less than 4 hours ................
4 hours to less than 6 hours ................
6 hours to less than 8 hours ................
8 hours to less than 10 hours ..............
10 hours to less than 12 hours ............
12 hours to less than 16 hours ............
More than 16 hours .............................
Not reported .........................................
Day of week:
Sunday ................................................
Monday ................................................
Tuesday ...............................................
Wednesday ..........................................
Thursday ..............................................
Friday ...................................................
Saturday ..............................................
1 Days-away-from-work cases include those that resulted in days away from work, some of which
also included job transfer or restriction.
2 Excludes farms with fewer than 11 employees.
3 Data for Mining (Sector 21 in the North American Industry Classification System-- United States,
2002) include establishments not governed by the Mine Safety and Health Administration rules and
reporting, such as those in Oil and Gas Extraction and related support activities. Data for mining
operators in coal, metal, and nonmetal mining are provided to BLS by the Mine Safety and Health
Administration, U.S. Department of Labor. Independent mining contractors are excluded from the
coal, metal, and nonmetal mining industries. These data do not reflect the changes the Occupational
Safety and Health Administration made to its recordkeeping requirements effective January 1, 2002;
therefore, estimates for these industries are not comparable to estimates in other industries.
4 Data for employers in rail transportation are provided to BLS by the Federal Railroad
Administration, U.S. Department of Transportation.
NOTE: Dash indicates data do not meet publication guidelines. Because of rounding and data
exclusion of nonclassifiable responses, data may not sum to the totals.
SOURCE: Bureau of Labor Statistics, U.S. Department of Labor, Survey of Occupational Injuries
and Illnesses in cooperation with participating State agencies
24
TABLE 14. Percent distribution of nonfatal occupational injuries and illnesses involving days away from work1 by time, hours on the job, day of week, and major industry
sector, 2008
Goods producing
Service providing
Characteristic
Total
cases
Total
goods
producing
Natural
resources
and
mining2,3
Construction
Manufacturing
Total
service
providing
Trade,
transportation and
utilities4
Information
Financial
activities
Professional
and
business
services
Education
and
health
services
Leisure
and
hospitality
Other
services
Total [1,078,140 cases] ..........................
100.0
100.0
100.0
100.0
100.0
100.0
100.0
100.0
100.0
100.0
100.0
100.0
100.0
3.0
9.8
28.8
22.6
10.0
5.4
20.4
2.8
10.8
31.4
22.3
7.0
3.9
21.9
2.8
11.1
29.9
21.2
7.8
3.5
23.7
.4
8.3
37.2
26.1
3.4
.5
24.0
4.6
12.5
27.3
19.7
9.5
6.4
20.0
3.1
9.5
27.7
22.8
11.2
6.0
19.7
3.8
10.2
26.9
22.8
11.3
6.1
18.8
4.2
7.1
30.6
23.6
10.7
5.3
18.5
.8
6.3
31.7
23.8
7.5
2.1
27.7
3.1
8.7
28.7
23.3
7.7
4.6
24.0
3.0
11.2
27.5
22.6
12.5
6.2
17.0
2.5
6.3
25.5
20.8
14.2
10.0
20.7
.6
6.9
35.0
25.1
7.0
1.9
23.4
.7
7.8
9.6
20.3
15.9
14.0
6.9
1.8
.6
.1
22.3
.5
6.4
8.9
19.7
15.4
14.6
8.3
2.0
.4
(5)
23.9
.1
5.5
5.7
15.6
11.4
10.1
7.6
2.7
.7
.1
40.4
.3
5.4
8.7
20.0
15.6
15.5
8.4
1.3
.2
(5)
24.6
.7
7.3
9.5
20.1
15.9
14.7
8.2
2.3
.5
(5)
20.7
.8
8.4
9.8
20.5
16.1
13.8
6.4
1.7
.7
.1
21.6
.4
8.1
10.4
20.4
15.8
14.0
7.0
1.8
.6
.1
21.3
1.2
8.9
9.7
20.2
14.7
14.7
9.2
1.8
.5
–
19.1
1.5
9.1
7.4
17.3
14.3
13.8
6.6
1.4
.4
.1
28.1
1.0
7.4
7.7
20.0
17.2
13.0
5.5
2.0
.7
–
25.6
1.4
9.6
9.8
20.5
16.3
14.6
6.1
2.1
.9
.2
18.5
.5
8.4
9.9
23.7
17.6
11.3
4.8
.6
.5
–
22.7
1.8
6.7
12.7
18.5
15.0
14.6
5.7
.8
.3
–
24.0
5.9
18.5
18.1
17.4
17.0
15.4
7.7
2.7
20.5
18.9
19.2
18.6
14.9
5.2
4.8
18.6
16.2
15.8
17.9
18.4
8.3
2.1
21.4
18.5
19.8
19.4
14.5
4.3
2.9
20.1
19.6
19.4
18.2
14.6
5.3
7.2
17.7
17.8
16.7
16.3
15.6
8.7
6.8
17.3
18.6
16.3
16.8
15.7
8.5
5.1
19.9
18.5
19.5
15.9
13.8
7.4
3.1
16.3
18.2
18.0
18.3
18.5
7.6
4.6
20.5
19.5
19.8
16.1
14.5
5.1
8.1
17.9
16.9
16.5
16.1
15.2
9.3
12.7
14.1
15.0
14.2
13.4
17.2
13.5
3.0
24.0
18.0
16.6
19.4
13.3
5.8
Time of event:
12:01 A.M. to 4:00 A.M. .......................
4:01 A.M. to 8:00 A.M. .........................
8:01 A.M. to 12:00 noon ......................
12:01 P.M. to 4:00 P.M. .......................
4:01 P.M. to 8:00 P.M. .........................
8:01 P.M. to 12:00 midnight .................
Not reported .........................................
Hours on the job before event
occurred:
Before shift began ...............................
Less than 1 hour ..................................
1 hour to less than 2 hours ..................
2 hours to less than 4 hours ................
4 hours to less than 6 hours ................
6 hours to less than 8 hours ................
8 hours to less than 10 hours ..............
10 hours to less than 12 hours ............
12 hours to less than 16 hours ............
More than 16 hours .............................
Not reported .........................................
Day of week:
Sunday ................................................
Monday ................................................
Tuesday ...............................................
Wednesday ..........................................
Thursday ..............................................
Friday ...................................................
Saturday ..............................................
1 Days-away-from-work cases include those that resulted in days away from work, some of which
also included job transfer or restriction.
2 Excludes farms with fewer than 11 employees.
3 Data for Mining (Sector 21 in the North American Industry Classification System-- United States,
2002) include establishments not governed by the Mine Safety and Health Administration rules and
reporting, such as those in Oil and Gas Extraction and related support activities. Data for mining
operators in coal, metal, and nonmetal mining are provided to BLS by the Mine Safety and Health
Administration, U.S. Department of Labor. Independent mining contractors are excluded from the
coal, metal, and nonmetal mining industries. These data do not reflect the changes the Occupational
Safety and Health Administration made to its recordkeeping requirements effective January 1, 2002;
therefore, estimates for these industries are not comparable to estimates in other industries.
4 Data for employers in rail transportation are provided to BLS by the Federal Railroad
Administration, U.S. Department of Transportation.
5 Data too small to be displayed.
NOTE: Dash indicates data do not meet publication guidelines. Because of rounding and data
exclusion of nonclassifiable responses, data may not sum to the totals.
SOURCE: Bureau of Labor Statistics, U.S. Department of Labor, Survey of Occupational Injuries
and Illnesses in cooperation with participating State agencies
25
TABLE 15. Percent distribution of nonfatal occupational injuries and illnesses involving days away from work1 by time, hours
on the job, day of week, and number of days away from work, 2008
Percent of days-away-from-work cases involving —
Characteristic
Total [1,078,140 cases] ................................
Total
cases
1 day
2 days
100.0
14.9
100.0
100.0
100.0
100.0
100.0
100.0
100.0
21 - 30
days
Median
31 days or days away
from work
more
3 - 5 days
6 - 10
days
11 - 20
days
11.0
17.8
11.9
11.7
6.8
26.0
8
13.2
14.1
15.5
15.9
15.0
13.8
13.5
10.0
10.3
11.7
10.9
12.1
11.3
10.0
16.6
16.9
18.0
17.8
18.7
19.2
17.5
10.9
12.1
11.9
11.6
12.5
11.9
11.8
12.7
11.8
11.2
11.5
11.6
11.8
12.3
6.4
6.6
6.3
7.2
6.4
6.3
7.7
30.2
28.0
25.4
25.1
23.7
25.7
27.3
10
9
7
7
7
7
10
100.0
100.0
100.0
100.0
100.0
100.0
100.0
100.0
100.0
100.0
100.0
15.4
14.3
16.9
15.5
15.4
15.0
15.7
12.0
11.2
3.3
13.2
11.6
10.1
12.6
11.5
11.5
11.3
10.6
9.3
9.7
4.3
9.9
16.6
19.2
17.0
18.4
18.2
18.2
15.9
18.0
15.4
9.8
17.3
17.1
12.1
11.0
12.1
11.5
12.1
12.0
12.7
12.6
6.5
11.9
9.2
11.2
10.5
11.6
11.9
11.4
12.4
12.5
14.8
9.8
12.2
4.9
6.2
7.0
6.3
6.7
6.0
7.8
7.4
8.8
6.5
7.6
25.0
26.9
25.1
24.6
24.7
25.9
25.7
28.0
27.5
57.6
28.0
7
8
7
7
7
7
8
10
11
54
10
100.0
100.0
100.0
100.0
100.0
100.0
100.0
15.4
15.2
15.1
15.6
15.2
13.1
14.2
12.4
10.7
11.2
11.8
9.3
10.9
12.2
17.0
17.3
18.2
17.7
18.4
17.8
18.0
12.9
13.0
11.6
11.1
11.3
11.6
12.8
12.6
10.6
11.3
12.5
11.9
12.0
11.6
6.2
6.9
7.1
6.7
6.8
6.6
6.7
23.7
26.3
25.6
24.5
27.0
28.1
24.6
7
8
7
7
8
9
8
Time of event:
12:01 A.M. to 4:00 A.M. .............................
4:01 A.M. to 8:00 A.M. ...............................
8:01 A.M. to 12:00 noon ............................
12:01 P.M. to 4:00 P.M. .............................
4:01 P.M. to 8:00 P.M. ...............................
8:01 P.M. to 12:00 midnight ......................
Not reported ..............................................
Hours on the job before event
occurred:
Before shift began .....................................
Less than 1 hour ........................................
1 hour to less than 2 hours ........................
2 hours to less than 4 hours ......................
4 hours to less than 6 hours ......................
6 hours to less than 8 hours ......................
8 hours to less than 10 hours ....................
10 hours to less than 12 hours ..................
12 hours to less than 16 hours ..................
More than 16 hours ...................................
Not reported ..............................................
Day of week:
Sunday ......................................................
Monday ......................................................
Tuesday .....................................................
Wednesday ...............................................
Thursday ...................................................
Friday ........................................................
Saturday ....................................................
1 Days-away-from-work cases include those that resulted in days away
from work, some of which also included job transfer or restriction.
may not sum to the totals.
SOURCE: Bureau of Labor Statistics, U.S. Department of Labor,
Survey of Occupational Injuries and Illnesses in cooperation with
participating State agencies
NOTE: Dash indicates data do not meet publication guidelines.
Because of rounding and data exclusion of nonclassifiable responses, data
26
TABLE 16. Incidence rates1 for nonfatal occupational injuries and illnesses involving days away from work2 per 10,000 full-time workers by selected worker characteristic, major
occupational group, and selected natures of injury or illness, 2008
Nature of injury or illness3
Characteristic
Total [1,078,140 cases] ..................................................................................................
Total
cases
Cuts, lacerations, punctures
Sprains,
strains,
tears
Fractures
Total
Cuts,
lacerations
Punctures
Bruises,
contusions
Heat
burns
Chemical
burns
Amputations
113.3
43.8
9.4
10.5
9.1
1.3
9.8
1.6
0.6
0.7
124.8
97.3
46.3
40.3
10.9
7.4
14.6
4.8
12.6
4.3
2.0
.5
9.8
9.8
1.8
1.5
.8
.3
1.0
.2
115.9
119.1
109.0
111.0
116.6
116.7
102.4
33.6
41.4
43.1
46.8
46.5
43.1
27.8
7.2
7.4
7.4
8.7
9.7
14.0
18.0
21.2
17.6
12.1
8.7
8.3
8.2
6.5
19.9
15.6
10.3
7.3
7.4
7.2
6.0
1.3
2.0
1.8
1.4
.9
1.0
.5
15.7
12.2
9.0
8.7
9.7
11.0
11.0
5.1
2.2
1.6
1.4
1.7
1.0
1.5
.8
.7
.8
.6
.6
.3
.2
.3
1.1
.6
.6
.7
.7
.5
36.2
14.7
12.1
23.7
28.3
99.6
20.2
62.8
47.7
90.9
243.5
117.9
92.8
244.7
109.8
62.0
51.0
142.0
221.7
209.1
157.9
278.4
13.6
4.2
4.5
7.7
9.8
42.9
9.1
20.2
20.7
46.4
132.1
42.6
26.9
104.7
45.2
24.0
20.2
39.5
74.6
78.2
50.0
115.9
4.5
1.9
.9
2.1
3.2
9.8
3.0
5.3
5.9
5.9
9.6
9.3
5.4
15.9
7.7
5.9
4.7
18.9
24.9
17.3
13.2
22.7
2.7
.8
.5
2.0
3.1
2.0
–
1.3
2.6
3.3
4.8
4.5
18.0
21.9
4.9
4.2
2.2
18.3
31.4
24.5
22.0
19.7
2.6
.8
.5
1.6
2.3
1.5
–
.4
2.4
2.1
3.5
3.5
17.5
19.5
3.9
3.8
2.0
15.1
24.6
20.7
19.4
18.0
.1
2.4
1.0
.7
1.1
3.4
10.6
1.1
5.3
2.8
8.5
20.8
10.3
8.3
20.4
9.7
6.7
5.6
17.8
14.9
14.5
12.4
26.8
.1
.1
Gender:
Male ............................................................................................................................
Female ........................................................................................................................
Age:
5
16 - 19 .........................................................................................................................
20 - 24 .........................................................................................................................
25 - 34 .........................................................................................................................
35 - 44 .........................................................................................................................
45 - 54 .........................................................................................................................
55 - 64 .........................................................................................................................
65 and over .................................................................................................................
Occupation:
Management occupations ...........................................................................................
Business and financial operations occupations ..........................................................
Computer and mathematical occupations ...................................................................
Architecture and engineering occupations ..................................................................
Life, physical, and social science occupations ............................................................
Community and social services occupations ..............................................................
Legal occupations .......................................................................................................
Education, training, and library occupations ...............................................................
Arts, design, entertainment, sports, and media occupations ......................................
Healthcare practitioners and technical occupations ....................................................
Healthcare support occupations .................................................................................
Protective service occupations ...................................................................................
Food preparation and serving related occupations .....................................................
Building and grounds cleaning and maintenance occupations ...................................
Personal care and service occupations ......................................................................
Sales and related occupations ....................................................................................
Office and administrative support occupations ...........................................................
Farming, fishing, and forestry occupations .................................................................
Construction and extraction occupations ....................................................................
Installation, maintenance, and repair occupations ......................................................
Production occupations ...............................................................................................
Transportation and material moving occupations .......................................................
See footnotes at end of table.
27
–
–
.4
.8
.5
–
.9
.2
1.2
1.4
1.0
.4
2.4
.9
.4
.2
3.2
6.8
3.8
2.6
1.8
–
.2
.4
.2
–
.5
–
.2
1.5
.3
7.7
1.0
1.0
1.0
.1
.7
1.9
3.0
3.8
2.3
.1
–
–
–
.1
–
–
.2
.6
–
–
–
–
.1
.3
–
–
–
–
–
–
.2
.3
.7
.8
–
.8
1.9
.2
.2
.3
.8
.8
1.8
1.2
1.5
–
.1
.1
1.9
1.2
2.0
2.9
1.0
TABLE 16. Incidence rates1 for nonfatal occupational injuries and illnesses involving days away from work2 per 10,000 full-time workers by selected worker characteristic, major
occupational group, and selected natures of injury or illness, 2008 — Continued
Nature of injury or illness3
Multiple traumatic injuries and disorders
Characteristic
Carpal
tunnel
syndrome
Total [1,078,140 cases] ..................................................................................................
Tendonitis
Total
With fractures,
burns, and
other injuries
With sprains and
bruises
Back pain and
pain, except back
Total
Back pain,
hurt back only
All
other
natures4
1.1
0.4
4.6
0.9
1.8
12.0
3.9
18.8
.7
1.6
.4
.5
4.8
4.4
1.2
.6
1.4
2.2
12.1
11.9
4.1
3.6
21.7
14.7
–
.1
.3
.4
.5
.5
.3
.4
4.1
4.1
4.0
4.0
4.8
6.2
8.1
.9
.6
.7
1.0
.8
1.4
2.6
1.9
1.4
1.4
1.6
1.9
2.4
2.4
9.5
11.3
10.9
11.9
13.7
12.0
11.1
1.9
4.2
4.0
3.9
4.4
3.1
2.1
18.3
20.6
18.4
18.0
18.8
18.2
16.8
3.1
2.0
1.1
1.9
.5
6.2
–
4.3
2.8
2.9
7.5
6.7
3.1
10.7
3.7
2.6
2.0
5.6
8.7
7.5
5.5
12.1
.5
.1
.1
.5
1.2
.9
–
.5
–
2.8
–
2.1
1.5
1.6
5.1
2.8
1.7
5.5
1.9
1.2
.8
1.1
1.9
1.6
1.6
4.3
2.9
1.7
1.4
2.2
1.6
9.7
1.6
14.5
4.3
9.8
34.8
11.9
9.1
28.2
11.7
7.1
6.0
13.0
21.5
19.4
12.7
31.6
.7
.4
.6
.6
.4
3.5
–
7.3
.7
3.3
13.5
3.1
2.1
8.8
4.6
2.4
1.5
3.8
7.6
6.3
3.6
11.0
6.3
2.5
1.3
5.7
4.9
17.7
5.0
10.1
8.2
13.2
30.3
31.8
11.5
37.9
25.1
9.7
8.2
24.7
40.4
39.1
29.6
42.9
Gender:
Male ............................................................................................................................
Female ........................................................................................................................
Age:
5
16 - 19 .........................................................................................................................
20 - 24 .........................................................................................................................
25 - 34 .........................................................................................................................
35 - 44 .........................................................................................................................
45 - 54 .........................................................................................................................
55 - 64 .........................................................................................................................
65 and over .................................................................................................................
.3
.7
1.0
1.6
1.7
.6
Occupation:
Management occupations ...........................................................................................
Business and financial operations occupations ..........................................................
Computer and mathematical occupations ...................................................................
Architecture and engineering occupations ..................................................................
Life, physical, and social science occupations ............................................................
Community and social services occupations ..............................................................
Legal occupations .......................................................................................................
Education, training, and library occupations ...............................................................
Arts, design, entertainment, sports, and media occupations ......................................
Healthcare practitioners and technical occupations ....................................................
Healthcare support occupations .................................................................................
Protective service occupations ...................................................................................
Food preparation and serving related occupations .....................................................
Building and grounds cleaning and maintenance occupations ...................................
Personal care and service occupations ......................................................................
Sales and related occupations ....................................................................................
Office and administrative support occupations ...........................................................
Farming, fishing, and forestry occupations .................................................................
Construction and extraction occupations ....................................................................
Installation, maintenance, and repair occupations ......................................................
Production occupations ...............................................................................................
Transportation and material moving occupations .......................................................
.4
.4
1.6
.3
.5
–
–
.1
.1
.3
.7
–
.8
.8
.6
.3
1.5
.4
.8
1.4
3.6
1.0
–
–
.1
.3
.3
–
–
1.3
–
.4
.7
–
.6
.6
.1
.2
.2
.4
.5
.5
1.1
.8
1 Incidence rates represent the number of injuries and illnesses per 10,000 full-time workers and were
calculated as: (N/EH) x 20,000,000 where
N
EH
= number of injuries and illnesses
= total hours worked by all employees
during the calendar year
20,000,000
= base for
(working
year)
10,000
40
equivalent full-time workers
hours
per
week,
50
weeks
–
.5
–
.8
.4
.5
.8
.9
.4
1.0
.6
.4
.3
1.8
2.5
1.9
1.6
2.9
contusions = 043; Heat burns = 053; Chemical burns = 051; Amputations = 031; Carpal tunnel syndrome =
1241; Tendonitis = 1733; Multiple traumatic injuries and illnesses, Total = 080-089; With fractures, burns,
and other injuries = 083, 084; With sprains and bruises = 082; Back pain and pain, except back, Total =
0972, 0973; Back pain, hurt back only = 0972; All other natures = all remaining codes, including 9999
(Nonclassifiable). These codes are based on the Occupational Injury and Illness Classification System
developed by the Bureau of Labor Statistics.
4 Includes nonclassifiable responses.
5 Information is not shown separately for injured workers under age 14; they accounted for fewer than 50
cases.
per
NOTE: Dash indicates data do not meet publication guidelines. Because of rounding and data exclusion
of nonclassifiable responses, data may not sum to the totals.
SOURCE: Bureau of Labor Statistics, U.S. Department of Labor, Survey of Occupational Injuries and
Illnesses in cooperation with participating State agencies
2
Days-away-from-work cases include those that resulted in days away from work, some of which also
included job transfer or restriction.
3 Data shown in columns correspond to the following Nature codes: Sprains, strains, tears = 021;
Fractures = 012; Cuts, lacerations, punctures = 034, 037; Cuts, lacerations = 034; Punctures = 037; Bruises,
28
TABLE 17. Incidence rates1 for nonfatal occupational injuries and illnesses involving days away from work2 per 10,000 full-time workers by selected worker characteristic, major
occupational group, and selected parts of body, 2008
Part of body affected by the injury or illness3
Characteristic
Total [1,078,140 cases] ...................................................................................
Head
Total
cases
Trunk
Upper extremities
Finger
Hand,
except
finger
Wrist
5.1
10.0
4.4
4.9
29.1
20.8
5.7
4.3
13.0
5.8
5.3
3.2
4.0
6.1
5.3
5.9
5.8
7.9
9.0
10.7
9.2
38.6
33.2
25.5
23.2
25.2
24.5
19.6
7.9
4.7
4.2
5.3
5.4
5.3
6.2
16.4
16.1
10.6
8.5
9.0
8.1
5.6
8.0
6.5
4.7
3.9
4.1
3.5
2.9
4.6
4.5
4.6
4.4
5.3
6.3
3.6
2.3
.5
.9
1.0
1.8
5.5
1.0
3.3
2.7
6.5
17.5
5.9
5.7
17.2
6.5
4.6
3.0
7.4
11.4
13.8
11.5
24.0
5.5
2.4
3.4
4.5
7.1
10.5
.8
8.9
5.9
14.7
37.3
12.8
36.1
47.9
23.5
11.3
9.8
33.7
51.6
51.4
56.2
50.5
1.9
.9
.4
.9
1.3
2.1
.2
3.5
2.0
3.8
9.3
3.5
5.3
10.3
5.1
2.9
1.8
8.9
9.0
8.9
8.3
12.7
1.4
.2
.8
1.6
.9
2.6
–
1.2
1.6
4.1
8.4
3.2
17.0
19.0
7.3
3.2
2.3
12.6
24.3
22.3
26.7
17.9
.4
.3
.1
.8
3.2
1.5
–
1.2
.9
1.8
5.6
1.9
7.1
7.9
4.5
1.8
1.3
8.0
9.6
11.0
8.9
8.9
1.3
.9
2.0
1.0
1.4
3.9
.2
1.5
1.2
4.2
10.8
2.9
5.4
8.2
5.7
3.0
3.7
3.2
6.3
7.2
9.5
8.7
Neck
Total
Eyes
Total
Back
113.3
7.7
2.9
124.8
97.3
9.4
5.3
115.9
119.1
109.0
111.0
116.6
116.7
102.4
10.4
10.4
8.6
7.8
6.6
5.7
6.6
36.2
14.7
12.1
23.7
28.3
99.6
20.2
62.8
47.7
90.9
243.5
117.9
92.8
244.7
109.8
62.0
51.0
142.0
221.7
209.1
157.9
278.4
2.0
.9
.6
2.2
1.6
5.3
.2
5.8
3.4
5.1
9.1
9.4
5.7
14.7
7.5
3.9
2.8
11.6
17.0
21.9
12.1
17.9
Shoulder
Total
1.7
38.5
23.4
7.8
25.7
4.0
1.3
1.6
1.8
43.3
31.9
25.1
20.9
8.7
6.5
3.8
4.4
3.6
3.0
2.4
1.5
.8
.4
1.9
1.7
2.0
1.6
1.5
1.1
26.8
36.2
37.2
40.3
41.3
38.8
32.8
16.6
24.8
24.8
25.0
24.2
18.7
13.8
.2
.9
.2
.1
.2
.2
3.8
–
1.4
.8
2.0
3.9
1.9
.3
5.0
2.2
.8
.8
1.9
2.3
3.6
1.4
4.8
11.5
3.1
3.2
7.4
9.7
24.7
5.6
20.1
13.8
37.6
109.4
26.8
23.4
91.0
35.7
20.9
17.1
42.3
71.0
72.2
46.0
105.4
7.0
1.9
2.0
5.4
6.2
14.7
4.5
15.2
8.7
26.1
77.5
12.6
14.8
55.7
23.8
13.0
10.9
24.8
43.6
42.5
23.9
59.3
Arm
Gender:
Male ..............................................................................................................
Female .........................................................................................................
Age:
5
16 - 19 ..........................................................................................................
20 - 24 ..........................................................................................................
25 - 34 ..........................................................................................................
35 - 44 ..........................................................................................................
45 - 54 ..........................................................................................................
55 - 64 ..........................................................................................................
65 and over ..................................................................................................
Occupation:
Management occupations ............................................................................
Business and financial operations occupations ............................................
Computer and mathematical occupations ....................................................
Architecture and engineering occupations ...................................................
Life, physical, and social science occupations .............................................
Community and social services occupations ................................................
Legal occupations ........................................................................................
Education, training, and library occupations .................................................
Arts, design, entertainment, sports, and media occupations ........................
Healthcare practitioners and technical occupations .....................................
Healthcare support occupations ...................................................................
Protective service occupations .....................................................................
Food preparation and serving related occupations ......................................
Building and grounds cleaning and maintenance occupations ....................
Personal care and service occupations ........................................................
Sales and related occupations .....................................................................
Office and administrative support occupations .............................................
Farming, fishing, and forestry occupations ...................................................
Construction and extraction occupations .....................................................
Installation, maintenance, and repair occupations .......................................
Production occupations ................................................................................
Transportation and material moving occupations .........................................
–
.1
1.1
.5
.7
–
1.6
.3
.9
2.7
1.7
1.8
6.2
1.6
.7
.6
5.0
9.0
9.8
7.2
5.1
See footnotes at end of table.
29
TABLE 17. Incidence rates1 for nonfatal occupational injuries and illnesses involving days away from work2 per 10,000 full-time workers by
selected worker characteristic, major occupational group, and selected parts of body, 2008 — Continued
Part of body affected by the injury or illness3
Lower extremities
Characteristic
Total [1,078,140 cases] ...................................................................................
Foot, toe
Body
systems
Multiple
body
parts
All
other
body
parts4
Total
Knee
Ankle
25.3
9.7
5.8
5.2
1.7
11.8
1.0
28.7
20.6
10.7
8.2
6.0
5.5
6.4
3.5
1.4
2.0
10.3
14.0
.9
1.0
29.5
27.0
24.0
25.0
25.0
26.8
24.4
8.8
7.5
8.1
10.2
10.3
12.2
10.5
7.4
6.7
6.6
6.1
5.1
4.4
3.5
7.8
7.9
5.2
4.5
4.9
4.5
4.6
1.2
1.5
2.0
1.5
1.7
1.8
1.0
7.9
8.5
9.1
10.7
14.3
16.7
16.5
1.2
.6
.9
.6
.9
1.0
.4
9.0
3.9
2.7
6.0
5.8
33.0
7.0
15.0
18.0
15.6
43.7
44.6
17.2
54.0
24.0
14.5
12.7
38.5
57.3
41.2
29.0
67.0
4.0
1.6
1.3
2.6
2.9
10.0
2.6
6.5
6.4
7.9
21.0
19.2
6.3
18.7
9.5
5.3
4.2
9.3
21.4
18.9
11.5
23.2
1.9
1.3
.3
1.2
.9
14.6
3.6
4.7
5.9
3.3
10.1
10.8
4.5
15.0
6.1
3.3
3.0
7.5
12.6
7.9
5.3
15.2
1.3
.5
.9
.8
1.1
3.7
.4
1.4
2.9
2.1
6.1
4.0
3.0
10.9
4.8
3.7
3.3
11.2
12.2
7.6
7.0
14.3
1.1
.3
.2
.5
.8
2.2
4.6
1.0
.7
2.2
2.8
2.2
1.7
5.2
1.1
1.5
1.3
1.8
2.7
1.8
1.6
2.0
6.1
3.4
1.8
2.9
2.5
19.6
1.7
10.5
5.0
12.9
35.1
19.3
7.6
24.6
14.8
8.6
6.2
10.8
18.9
16.2
10.6
27.4
.2
.5
.1
.2
.7
.6
Gender:
Male ..............................................................................................................
Female .........................................................................................................
Age:
5
16 - 19 ..........................................................................................................
20 - 24 ..........................................................................................................
25 - 34 ..........................................................................................................
35 - 44 ..........................................................................................................
45 - 54 ..........................................................................................................
55 - 64 ..........................................................................................................
65 and over ..................................................................................................
Occupation:
Management occupations ............................................................................
Business and financial operations occupations ............................................
Computer and mathematical occupations ....................................................
Architecture and engineering occupations ...................................................
Life, physical, and social science occupations .............................................
Community and social services occupations ................................................
Legal occupations ........................................................................................
Education, training, and library occupations .................................................
Arts, design, entertainment, sports, and media occupations ........................
Healthcare practitioners and technical occupations .....................................
Healthcare support occupations ...................................................................
Protective service occupations .....................................................................
Food preparation and serving related occupations ......................................
Building and grounds cleaning and maintenance occupations ....................
Personal care and service occupations ........................................................
Sales and related occupations .....................................................................
Office and administrative support occupations .............................................
Farming, fishing, and forestry occupations ...................................................
Construction and extraction occupations .....................................................
Installation, maintenance, and repair occupations .......................................
Production occupations ................................................................................
Transportation and material moving occupations .........................................
1 Incidence rates represent the number of injuries and illnesses per 10,000
full-time workers and were calculated as: (N/EH) x 20,000,000 where
N
EH
= number of injuries and illnesses
= total hours worked by all employees
during the calendar year
20,000,000
= base for 10,000 equivalent full-time workers
(working 40 hours per week, 50 weeks
year)
–
–
–
.8
2.0
.8
.8
2.2
.7
.4
.4
1.4
.9
.9
.9
3.2
Shoulder = 21; Upper extremities, Total = 30-39; Arm = 31; Finger = 34; Hand,
except finger = 33; Wrist = 32; Lower extremities, Total = 40-49; Knee = 412; Ankle
= 42; Foot, toe = 43, 44; Body systems = 5; Multiple body parts = 8; All other body
parts = remaining codes, including 9999 (Nonclassifiable). These codes are based
on the Occupational Injury and Illness Classification System developed by the
Bureau of Labor Statistics.
4 Includes nonclassifiable responses.
5 Information is not shown separately for injured workers under age 14; they
accounted for fewer than 50 cases.
per
NOTE: Dash indicates data do not meet publication guidelines. Because of
rounding and data exclusion of nonclassifiable responses, data may not sum to the
totals.
SOURCE: Bureau of Labor Statistics, U.S. Department of Labor, Survey of
Occupational Injuries and Illnesses in cooperation with participating State agencies
2
Days-away-from-work cases include those that resulted in days away from
work, some of which also included job transfer or restriction.
3 Data shown in columns correspond to the following Part of body codes: Head,
Total = 00-09; Eyes = 032; Neck = 10-19; Trunk, Total = 20-29; Back = 23;
30
TABLE 18. Incidence rates1 for nonfatal occupational injuries and illnesses involving days away from work2 per 10,000 full-time workers by selected
worker characteristic, major occupational group, and selected sources of injury or illness, 2008
Source of injury or illness3
Characteristic
Total [1,078,140 cases] ...................................................................................
Total
cases
Chemicals
and
chemical
products
Containers
Furniture
and
fixtures
Machinery
Parts
and
materials
Floors,
walkways
or
ground
surfaces
113.3
1.6
13.7
4.4
6.7
11.2
22.8
124.8
97.3
1.9
1.2
15.7
11.0
4.1
5.0
9.1
3.5
17.7
2.3
20.2
26.7
115.9
119.1
109.0
111.0
116.6
116.7
102.4
2.0
1.7
1.8
1.7
1.6
1.2
.6
15.9
14.5
13.2
13.7
14.8
12.5
8.9
5.6
5.4
4.5
3.7
4.7
4.7
3.7
9.3
10.0
6.9
6.4
6.2
5.6
6.4
10.5
14.0
12.6
11.5
10.6
9.4
4.6
18.5
16.6
17.2
20.6
25.2
34.3
40.6
36.2
14.7
12.1
23.7
28.3
99.6
20.2
62.8
47.7
90.9
243.5
117.9
92.8
244.7
109.8
62.0
51.0
142.0
221.7
209.1
157.9
278.4
.2
.1
3.2
1.5
.5
1.3
1.7
3.6
4.2
1.9
1.1
2.6
6.3
3.6
17.6
25.6
6.9
12.0
10.9
12.0
9.7
13.6
18.1
54.2
2.2
.5
.3
.5
.8
2.7
–
6.2
3.6
5.5
10.3
2.3
4.6
19.5
2.9
4.5
2.3
1.0
4.4
5.7
4.2
8.3
1.6
.9
1.6
1.3
.6
1.9
–
.1
.6
1.2
3.6
1.5
7.0
14.1
1.9
2.4
1.8
7.9
12.9
19.0
21.9
12.3
1.3
.2
.8
3.0
1.0
.9
.5
1.2
.8
1.0
.9
2.3
.8
12.7
2.3
2.4
1.5
13.4
53.9
37.7
27.2
28.9
12.0
4.5
3.0
4.3
10.6
31.3
8.7
23.2
12.0
20.4
47.1
35.2
23.4
55.6
25.8
16.1
13.9
27.8
42.1
31.6
20.8
46.2
Gender:
Male ..............................................................................................................
Female .........................................................................................................
Age:
5
16 - 19 ..........................................................................................................
20 - 24 ..........................................................................................................
25 - 34 ..........................................................................................................
35 - 44 ..........................................................................................................
45 - 54 ..........................................................................................................
55 - 64 ..........................................................................................................
65 and over ..................................................................................................
Occupation:
Management occupations ............................................................................
Business and financial operations occupations ............................................
Computer and mathematical occupations ....................................................
Architecture and engineering occupations ...................................................
Life, physical, and social science occupations .............................................
Community and social services occupations ................................................
Legal occupations ........................................................................................
Education, training, and library occupations .................................................
Arts, design, entertainment, sports, and media occupations ........................
Healthcare practitioners and technical occupations .....................................
Healthcare support occupations ...................................................................
Protective service occupations .....................................................................
Food preparation and serving related occupations ......................................
Building and grounds cleaning and maintenance occupations ....................
Personal care and service occupations ........................................................
Sales and related occupations .....................................................................
Office and administrative support occupations .............................................
Farming, fishing, and forestry occupations ...................................................
Construction and extraction occupations .....................................................
Installation, maintenance, and repair occupations .......................................
Production occupations ................................................................................
Transportation and material moving occupations .........................................
–
.3
2.1
.6
–
.3
.2
1.7
2.3
.7
1.6
4.6
1.0
.5
.8
2.0
3.1
3.6
3.2
2.9
See footnotes at end of table.
31
TABLE 18. Incidence rates1 for nonfatal occupational injuries and illnesses involving days away from work2 per 10,000 full-time workers by selected
worker characteristic, major occupational group, and selected sources of injury or illness, 2008 — Continued
Source of injury or illness3
Person, injured or ill worker
Characteristic
Handtools
Total [1,078,140 cases] ...................................................................................
Total
Worker
motion
or
position
Vehicles
Person, other than injured or
ill worker
Total
Health
care
patient
All
other
sources4
5.3
9.6
16.4
15.7
6.5
5.2
14.9
7.5
2.2
12.5
5.5
17.0
15.8
16.3
15.0
2.2
12.5
1.2
10.7
17.0
11.6
9.2
8.8
6.3
5.2
4.4
2.8
2.1
8.3
9.8
9.3
9.3
10.4
9.8
10.9
10.9
11.8
15.1
17.7
18.9
18.2
11.4
10.5
11.3
14.4
17.0
18.1
17.3
11.0
5.4
8.5
7.4
6.7
6.2
4.8
3.3
3.4
7.0
5.7
5.4
5.1
3.7
2.5
20.3
18.0
14.9
14.7
13.6
13.4
9.9
.6
(6)
.4
1.5
1.1
.3
–
.6
.8
.7
1.0
.6
9.7
14.2
2.6
1.9
.8
10.3
19.2
16.2
11.3
6.6
3.6
1.2
.5
2.2
.4
10.6
.7
1.7
2.9
3.3
7.2
13.7
1.9
13.8
10.5
5.1
4.2
11.9
10.9
19.4
6.2
52.2
6.8
2.6
2.9
5.3
3.6
19.0
.7
8.6
13.5
12.4
26.1
19.0
10.3
36.0
15.3
8.7
9.3
13.0
30.6
31.3
26.3
37.7
6.4
2.4
2.9
5.2
3.5
17.8
.6
7.9
13.2
11.9
25.5
17.6
10.0
33.0
14.8
8.0
8.8
12.4
29.3
30.6
25.7
35.7
1.8
.9
–
.1
1.2
22.1
–
11.7
2.7
29.9
112.7
16.9
1.1
1.1
17.1
1.2
.9
–
.4
.5
.3
1.2
1.3
.1
–
–
1.0
15.3
–
2.8
–
28.3
107.6
4.1
(6)
.3
10.4
–
.3
–
–
.1
(6)
.3
3.0
2.3
2.0
3.8
5.1
6.5
1.0
7.4
9.5
12.1
26.1
22.2
14.8
47.4
23.5
7.1
4.7
42.6
34.4
30.4
18.4
27.8
Gender:
Male ..............................................................................................................
Female .........................................................................................................
Age:
5
16 - 19 ..........................................................................................................
20 - 24 ..........................................................................................................
25 - 34 ..........................................................................................................
35 - 44 ..........................................................................................................
45 - 54 ..........................................................................................................
55 - 64 ..........................................................................................................
65 and over ..................................................................................................
Occupation:
Management occupations ............................................................................
Business and financial operations occupations ............................................
Computer and mathematical occupations ....................................................
Architecture and engineering occupations ...................................................
Life, physical, and social science occupations .............................................
Community and social services occupations ................................................
Legal occupations ........................................................................................
Education, training, and library occupations .................................................
Arts, design, entertainment, sports, and media occupations ........................
Healthcare practitioners and technical occupations .....................................
Healthcare support occupations ...................................................................
Protective service occupations .....................................................................
Food preparation and serving related occupations ......................................
Building and grounds cleaning and maintenance occupations ....................
Personal care and service occupations ........................................................
Sales and related occupations .....................................................................
Office and administrative support occupations .............................................
Farming, fishing, and forestry occupations ...................................................
Construction and extraction occupations .....................................................
Installation, maintenance, and repair occupations .......................................
Production occupations ................................................................................
Transportation and material moving occupations .........................................
1 Incidence rates represent the number of injuries and illnesses per 10,000 full-time
workers and were calculated as: (N/EH) x 20,000,000 where
N
EH
= number of injuries and illnesses
= total hours worked by all employees
during the calendar year
20,000,000
= base for 10,000 equivalent full-time workers
(working
40
hours
per
week,
50
weeks
year)
Machinery = 30-39; Parts and materials = 40-49; Person, injured or ill worker = 56;
Worker motion or position = 562; Person, other than injured or ill worker = 57; Health
care patient = 573; Floors, walkways, or ground surfaces = 62; Handtools = 71-73;
Vehicles = 80-89; All other sources = all remaining codes, including 9999
(Nonclassifiable). These codes are based on the Occupational Injury and Illness
Classification System developed by the Bureau of Labor Statistics.
4 Includes nonclassifiable responses.
5 Information is not shown separately for injured workers under age 14; they
accounted for fewer than 50 cases.
6 Data too small to be displayed.
per
2 Days-away-from-work cases include those that resulted in days away from work,
some of which also included job transfer or restriction.
3 Data shown in columns correspond to the following Source codes: Chemicals and
chemical products = 00-09; Containers = 10-19; Furniture and fixtures = 20-29;
NOTE: Dash indicates data do not meet publication guidelines. Because of rounding
and data exclusion of nonclassifiable responses, data may not sum to the totals.
SOURCE: Bureau of Labor Statistics, U.S. Department of Labor, Survey of
Occupational Injuries and Illnesses in cooperation with participating State agencies
32
TABLE 19. Incidence rates1 for nonfatal occupational injuries and illnesses involving days away from work2 per 10,000 full-time workers by selected worker characteristic
major occupational group, and selected events or exposures leading to injury or illness, 2008
Event or exposure leading to injury or illness3
Contact with objects
Characteristic
Total [1,078,140 cases] ...................................................................................
Total
cases
Struck
against
object
Overexertion
Caught in or
compressed or
crushed
Fall
to
lower
level
Fall
on
same
level
Total
Struck
by
object
113.3
30.7
16.1
7.4
5.2
7.1
16.6
124.8
97.3
40.0
17.7
20.8
9.5
9.3
4.8
7.0
2.6
8.7
4.8
115.9
119.1
109.0
111.0
116.6
116.7
102.4
48.6
46.1
33.6
28.3
26.7
24.3
19.2
24.9
24.8
18.1
15.0
13.8
11.9
8.3
13.8
9.9
7.8
6.8
6.5
6.8
5.5
7.7
8.7
5.3
4.5
4.5
4.4
4.7
36.2
14.7
12.1
23.7
28.3
99.6
20.2
62.8
47.7
90.9
243.5
117.9
92.8
244.7
109.8
62.0
51.0
142.0
221.7
209.1
157.9
278.4
5.5
1.8
2.5
5.6
3.7
7.5
.8
9.9
11.3
11.9
27.7
18.2
31.3
59.9
17.1
14.1
10.0
52.1
81.3
70.9
61.8
73.1
2.2
1.1
1.5
2.1
1.9
3.9
.3
6.1
4.3
6.0
16.1
8.0
18.0
27.9
8.8
8.2
5.5
30.4
47.9
35.6
27.4
39.0
2.1
.4
.4
2.1
1.1
2.4
–
3.6
5.3
3.9
7.6
6.1
8.5
17.1
4.9
3.9
2.7
9.3
17.3
18.4
12.0
16.2
.9
.1
.5
.7
.5
.7
.4
.2
.6
1.5
2.8
2.2
3.4
9.3
2.6
1.4
1.3
9.2
9.4
11.0
18.0
13.6
Slips
or
trips
without
fall
Total
In lifting
3.7
26.4
13.7
12.3
22.6
3.9
3.5
28.9
23.0
15.4
11.3
5.8
5.6
6.1
7.1
7.7
8.4
8.2
14.3
11.1
11.5
14.1
18.8
27.3
33.7
3.2
2.5
3.2
4.6
3.6
4.4
4.2
18.8
25.9
25.8
28.2
28.9
24.8
15.4
11.2
14.4
14.4
14.2
14.5
11.7
7.1
2.5
1.3
.6
1.2
1.0
7.3
6.3
4.8
4.0
2.8
6.1
7.3
2.2
18.7
6.6
3.5
2.8
13.6
27.3
16.4
5.6
18.0
9.3
4.0
2.6
3.6
10.3
23.4
2.5
18.5
7.1
17.9
42.4
28.0
21.4
39.4
19.5
13.4
11.5
12.4
17.5
16.9
16.1
30.2
1.2
.4
.4
1.0
1.0
2.3
–
2.0
1.1
2.7
9.7
4.9
3.9
9.2
3.7
1.6
2.1
2.6
6.7
6.6
3.9
9.5
6.4
1.5
2.2
3.7
3.7
11.5
4.7
10.2
3.9
31.8
101.7
10.5
13.2
57.8
26.4
15.3
12.0
15.5
40.2
47.5
32.5
73.0
3.4
.9
1.2
2.4
1.6
4.1
.7
4.1
1.9
15.1
42.3
4.3
9.1
30.9
9.3
9.1
7.7
8.0
20.5
26.4
16.0
36.9
Gender:
Male ..............................................................................................................
Female .........................................................................................................
Age:6
16 - 19 ..........................................................................................................
20 - 24 ..........................................................................................................
25 - 34 ..........................................................................................................
35 - 44 ..........................................................................................................
45 - 54 ..........................................................................................................
55 - 64 ..........................................................................................................
65 and over ..................................................................................................
Occupation:
Management occupations ............................................................................
Business and financial operations occupations ............................................
Computer and mathematical occupations ....................................................
Architecture and engineering occupations ...................................................
Life, physical, and social science occupations .............................................
Community and social services occupations ................................................
Legal occupations ........................................................................................
Education, training, and library occupations .................................................
Arts, design, entertainment, sports, and media occupations ........................
Healthcare practitioners and technical occupations .....................................
Healthcare support occupations ...................................................................
Protective service occupations .....................................................................
Food preparation and serving related occupations ......................................
Building and grounds cleaning and maintenance occupations ....................
Personal care and service occupations ........................................................
Sales and related occupations .....................................................................
Office and administrative support occupations .............................................
Farming, fishing, and forestry occupations ...................................................
Construction and extraction occupations .....................................................
Installation, maintenance, and repair occupations .......................................
Production occupations ................................................................................
Transportation and material moving occupations .........................................
See footnotes at end of table.
33
TABLE 19. Incidence rates1 for nonfatal occupational injuries and illnesses involving days away from work2 per 10,000 full-time workers by selected worker characteristic
major occupational group, and selected events or exposures leading to injury or illness, 2008 — Continued
Event or exposure leading to injury or illness3
Transportation accidents
Characteristic
Total [1,078,140 cases] ...................................................................................
Repetitive
motion
Exposure to
harmful
substance or
environment
Total
Highway
accident
Assaults and violent acts
Fires
and
explosions
All other assaults
Total
By
person
Total
Assaults
by
animal
All
other
events4
3.2
4.8
5.1
3.1
0.2
2.4
1.7
0.7
0.6
13.1
2.4
4.5
5.2
4.2
6.6
3.0
3.8
2.1
.4
(5)
1.6
3.5
1.1
2.6
.5
.9
.5
.8
14.8
10.4
.7
1.7
2.5
3.4
4.4
4.4
1.6
9.5
5.7
5.5
4.5
4.5
3.6
2.2
2.5
5.3
5.3
5.0
5.3
4.9
7.7
.7
3.1
3.0
3.2
3.4
3.2
4.2
.1
.2
.2
.2
.4
.1
1.2
2.9
3.5
2.6
2.5
2.1
1.9
1.2
2.1
2.6
2.1
1.6
1.3
1.6
1.0
.8
.9
.5
.9
.7
.3
.2
.7
.9
.5
.9
.7
.3
.2
9.5
11.4
13.0
13.2
14.3
12.4
7.8
.9
1.1
1.9
.7
1.6
.4
.2
1.6
1.2
1.7
2.2
.4
1.8
4.2
1.6
1.3
3.6
2.1
3.2
4.4
10.9
4.9
1.3
.6
.2
1.3
3.9
3.8
4.6
1.3
.7
3.5
8.4
2.9
10.4
12.7
4.6
1.7
1.8
6.4
8.2
9.3
8.8
6.2
3.0
.9
.4
1.9
.3
9.8
.7
1.5
1.6
2.1
4.5
9.5
.4
9.1
4.7
2.4
1.8
8.8
6.2
9.1
2.0
28.4
2.5
.7
.3
1.2
.3
8.5
.5
1.3
1.4
1.9
3.5
3.7
.2
4.8
2.7
1.4
.8
1.9
3.0
6.6
.6
17.9
(5)
–
–
–
–
–
–
–
–
(5)
.2
.2
.1
.4
–
.3
(5)
–
.8
.6
.4
.7
.8
1.1
.3
.5
1.2
16.2
–
6.2
1.5
5.9
18.6
19.7
1.0
2.4
12.9
1.1
.5
8.9
.5
1.0
.4
1.5
.7
.7
.1
.3
.1
.3
5.2
2.1
1.0
4.1
1.7
17.3
.4
6.8
15.2
10.4
21.9
16.3
7.1
30.8
12.5
7.2
5.0
19.5
29.8
26.2
15.5
33.0
Gender:
Male ..............................................................................................................
Female .........................................................................................................
Age:6
16 - 19 ..........................................................................................................
20 - 24 ..........................................................................................................
25 - 34 ..........................................................................................................
35 - 44 ..........................................................................................................
45 - 54 ..........................................................................................................
55 - 64 ..........................................................................................................
65 and over ..................................................................................................
Occupation:
Management occupations ............................................................................
Business and financial operations occupations ............................................
Computer and mathematical occupations ....................................................
Architecture and engineering occupations ...................................................
Life, physical, and social science occupations .............................................
Community and social services occupations ................................................
Legal occupations ........................................................................................
Education, training, and library occupations .................................................
Arts, design, entertainment, sports, and media occupations ........................
Healthcare practitioners and technical occupations .....................................
Healthcare support occupations ...................................................................
Protective service occupations .....................................................................
Food preparation and serving related occupations ......................................
Building and grounds cleaning and maintenance occupations ....................
Personal care and service occupations ........................................................
Sales and related occupations .....................................................................
Office and administrative support occupations .............................................
Farming, fishing, and forestry occupations ...................................................
Construction and extraction occupations .....................................................
Installation, maintenance, and repair occupations .......................................
Production occupations ................................................................................
Transportation and material moving occupations .........................................
1 Incidence rates represent the number of injuries and illnesses per 10,000 full-time workers and
were calculated as: (N/EH) x 20,000,000 where
N
EH
= number of injuries and illnesses
= total hours worked by all employees
during the calendar year
20,000,000
= base for
(working
year)
10,000 equivalent full-time workers
40
hours
per
week,
50
weeks
–
–
.8
15.7
–
6.1
.5
4.0
16.4
19.0
.9
.7
5.9
.9
.4
.6
.2
.4
.2
.9
–
–
.4
.3
.5
.4
.3
.4
–
–
1.0
1.9
2.2
.7
.1
1.7
7.1
.1
.2
8.3
.2
.6
.2
.6
–
–
1.0
1.8
2.2
.6
5
( )
1.7
7.0
.1
.1
8.1
.2
.6
.2
.5
fall = 215; Overexertion, Total = 220-229; In lifting = 221; Repetitive motion = 230-239; Exposure to
harmful substance or environment = 30-39; Transportation accidents = 40-49; Highway accident = 41;
Fires and explosions = 50-52; Assaults and violent acts, Total = 60-63; Assaults by person = 61; All
other assaults = 60, 62, and 63; Assaults by animal = 63; All other events = all remaining codes,
including 9999 (Nonclassifiable). These codes are based on the Occupational Injury and Illness
Classification System developed by the Bureau of Labor Statistics.
4 Includes nonclassifiable responses.
5 Data too small to be displayed.
6 Information is not shown separately for injured workers under age 14; they accounted for fewer
than 50 cases.
per
2 Days-away-from-work cases include those that resulted in days away from work, some of which
also included job transfer or restriction.
3 Data shown in columns correspond to the following Event codes: Contact with objects, Total =
00-09; Struck by object = 020-029; Struck against object = 010-019; Caught in or compressed or
crushed = 030-049; Fall to lower level = 110-119; Fall on same level = 130-139; Slips or trips without
NOTE: Dash indicates data do not meet publication guidelines. Because of rounding and data
exclusion of nonclassifiable responses, data may not sum to the totals.
SOURCE: Bureau of Labor Statistics, U.S. Department of Labor, Survey of Occupational Injuries
and Illnesses in cooperation with participating State agencies
34
TABLE 20. Incidence rates1 for nonfatal occupational injuries and illnesses involving days away from work2 per 10,000 full-time workers by selected worker
occupation3 and selected nature of injury or illness, 2008
Nature of injury or illness4
Cuts, lacerations, punctures
Occupation
Total
cases
Sprains,
strains,
tears
Fractures
Total
Cuts,
lacerations
Punctures
Bruises,
contusions
Heat
burns
Total [1,078,140 cases] .........................................
113.3
43.8
9.4
10.5
9.1
1.3
9.8
1.6
Nursing aides, orderlies, and attendants ................
Laborers and freight, stock, and material movers,
hand ....................................................................
Emergency medical technicians and paramedics ..
Construction laborers .............................................
Truck drivers, heavy and tractor-trailer ..................
Reservation and transportation ticket agents and
travel clerks ..........................................................
Roofers ...................................................................
Cooks, institution and cafeteria ..............................
Truck drivers, light or delivery services ..................
Industrial machinery mechanics .............................
Food servers, nonrestaurant ..................................
Welders, cutters, solderers, and brazers ...............
Maids and housekeeping cleaners .........................
Automotive service technicians and mechanics .....
Taxi drivers and chauffeurs ....................................
Heating, air conditioning, and refrigeration
mechanics and installers ......................................
Janitors and cleaners, except maids and
housekeeping cleaners ........................................
Plumbers, pipefitters, and steamfitters ...................
Carpenters .............................................................
Butchers and meat cutters .....................................
Bus and truck mechanics and diesel engine
specialists .............................................................
Telecommunications line installers and repairers ..
Maintenance and repair workers, general ..............
Sheet metal workers ..............................................
Painters, construction and maintenance ................
449.0
270.3
11.6
4.8
3.8
1.0
40.6
.7
440.3
387.0
383.1
362.0
166.1
252.4
120.9
157.5
35.7
8.6
44.8
36.7
45.3
1.5
54.1
18.1
39.9
–
40.4
17.4
5.4
–
13.7
.7
48.2
11.8
35.4
33.0
353.8
349.2
330.7
323.8
299.9
298.4
292.1
277.7
254.2
251.8
225.2
110.2
106.9
142.8
119.6
108.0
72.5
120.2
75.8
131.5
22.7
66.6
16.9
20.3
22.6
19.1
38.9
17.6
13.9
9.5
10.0
58.8
42.2
15.1
31.4
45.1
28.9
12.4
45.4
15.2
9.9
45.1
42.1
14.7
29.6
44.5
25.8
10.9
41.4
15.1
–
13.6
–
.4
1.8
–
3.1
1.4
4.0
–
45.3
17.3
24.4
25.2
29.9
33.3
18.3
28.7
26.7
19.2
Chemical
burns
Amputations
0.6
0.7
–
–
3.7
–
4.2
4.4
1.9
–
1.3
1.7
2.0
–
1.7
1.2
–
12.2
40.3
.8
4.8
14.5
12.5
.5
7.3
–
–
–
2.2
–
1.0
2.6
.9
2.7
3.9
–
–
–
–
.2
5.1
–
1.6
.5
2.4
–
243.9
91.7
23.1
30.2
28.0
2.2
13.7
2.9
7.3
2.8
243.0
241.4
235.7
234.2
104.4
93.6
70.7
62.2
14.1
14.7
20.4
6.3
20.6
26.6
49.9
87.4
18.1
24.2
31.4
86.1
2.6
2.4
18.5
1.4
19.1
18.2
12.7
7.0
1.6
4.1
–
5.9
2.4
2.6
.4
–
1.0
.8
1.8
9.0
230.6
230.6
212.7
211.7
209.9
74.6
124.8
77.3
66.7
70.0
27.3
7.8
18.4
11.6
43.7
16.4
3.6
25.0
46.4
12.5
13.4
3.0
19.6
44.1
8.5
2.9
–
5.4
2.3
4.0
18.8
8.0
11.8
10.3
11.7
2.3
–
3.0
–
1.6
–
–
2.0
–
4.5
.8
–
2.8
–
–
See footnotes at end of table.
35
TABLE 20. Incidence rates1 for nonfatal occupational injuries and illnesses involving days away from work2 per 10,000 full-time workers by
selected worker occupation3 and selected nature of injury or illness, 2008 — Continued
Nature of injury or illness4
Multiple traumatic injuries and disorders
Occupation
Carpal
tunnel
syndrome
Tendonitis
Total
With
fractures,
burns, and
other injuries
With sprains
and
bruises
Back pain and
pain, except back
Total
Back pain,
hurt back only
All
other
natures5
Total [1,078,140 cases] .........................................
1.1
0.4
4.6
0.9
1.8
12.0
3.9
18.8
Nursing aides, orderlies, and attendants ................
Laborers and freight, stock, and material movers,
hand ....................................................................
Emergency medical technicians and paramedics ..
Construction laborers .............................................
Truck drivers, heavy and tractor-trailer ..................
Reservation and transportation ticket agents and
travel clerks ..........................................................
Roofers ...................................................................
Cooks, institution and cafeteria ..............................
Truck drivers, light or delivery services ..................
Industrial machinery mechanics .............................
Food servers, nonrestaurant ..................................
Welders, cutters, solderers, and brazers ...............
Maids and housekeeping cleaners .........................
Automotive service technicians and mechanics .....
Taxi drivers and chauffeurs ....................................
Heating, air conditioning, and refrigeration
mechanics and installers ......................................
Janitors and cleaners, except maids and
housekeeping cleaners ........................................
Plumbers, pipefitters, and steamfitters ...................
Carpenters .............................................................
Butchers and meat cutters .....................................
Bus and truck mechanics and diesel engine
specialists .............................................................
Telecommunications line installers and repairers ..
Maintenance and repair workers, general ..............
Sheet metal workers ..............................................
Painters, construction and maintenance ................
.4
1.3
10.4
.6
7.3
60.2
24.8
48.7
2.3
–
.3
.4
1.0
–
.5
1.1
14.1
4.3
14.4
22.6
3.4
1.3
3.7
6.8
4.8
2.0
3.9
9.3
48.6
58.7
35.7
38.6
16.9
23.1
10.8
14.5
71.5
49.3
69.8
46.6
–
–
21.4
.5
1.6
–
4.5
.8
1.6
–
–
4.1
4.9
.8
–
2.0
.6
1.5
1.1
–
11.5
10.9
19.8
15.4
11.3
12.7
9.0
10.1
9.6
13.6
–
2.9
–
1.5
3.7
–
2.1
.9
.8
–
8.3
–
3.6
5.7
1.5
7.8
2.7
6.7
.9
4.6
9.7
18.4
28.0
53.7
19.3
26.2
15.9
47.9
25.0
31.1
2.9
8.9
7.3
18.5
9.8
6.3
4.0
11.4
4.0
13.6
28.0
49.5
23.2
48.9
52.7
33.9
88.5
34.9
41.6
31.4
3.1
1.0
–
.3
4.0
1.2
2.7
.6
3.1
3.2
–
5.4
2.0
1.6
20.5
7.0
43.0
–
1.3
–
12.1
12.2
7.8
2.3
1.1
4.9
2.1
–
7.5
1.3
2.5
–
27.4
26.6
29.6
15.5
10.8
19.1
10.0
6.6
38.8
41.4
40.6
33.7
–
2.2
.6
–
–
10.5
17.6
8.6
11.4
5.3
–
4.8
1.6
8.9
2.1
1.2
9.5
1.5
–
2.2
17.7
11.4
21.5
18.1
23.2
7.3
2.0
5.8
7.1
2.1
60.5
52.2
41.1
40.6
33.7
.4
1 Incidence rates represent the number of injuries and illnesses per 10,000
full-time workers and were calculated as: (N/EH) x 20,000,000 where
N
EH
= number of injuries and illnesses
= total hours worked by all employees
during the calendar year
20,000,000
= base for 10,000 equivalent full-time workers
(working 40 hours per week, 50 weeks
year)
Cuts, lacerations = 034; Punctures = 037; Bruises, contusions = 043; Heat burns
= 053; Chemical burns = 051; Amputations = 031; Carpal tunnel syndrome =
1241; Tendonitis = 1733; Multiple traumatic injuries and illnesses, Total =
080-089; With fractures, burns, and other injuries = 083, 084; With sprains and
bruises = 082; Back pain and pain, except back, Total = 0972, 0973; Back pain,
hurt back only = 0972; All other natures = all remaining codes, including 9999
(Nonclassifiable). These codes are based on the Occupational Injury and Illness
Classification System developed by the Bureau of Labor Statistics.
5 Includes nonclassifiable responses.
per
NOTE: Dash indicates data do not meet publication guidelines. Because of
rounding and data exclusion of nonclassifiable responses, data may not sum to
the totals.
SOURCE: Bureau of Labor Statistics, U.S. Department of Labor, Survey of
Occupational Injuries and Illnesses in cooperation with participating State
agencies
2
Days-away-from-work cases include those that resulted in days away from
work, some of which also included job transfer or restriction.
3 These occupations have at least 0.1% of full-time equivalent employment.
4 Data shown in columns correspond to the following Nature codes: Sprains,
strains, tears = 021; Fractures = 012; Cuts, lacerations, punctures = 034, 037;
36
TABLE 21. Incidence rates1 for nonfatal occupational injuries and illnesses involving days away from work2 per 10,000 full-time workers by selected
worker occupation3 and selected parts of body, 2008
Part of body affected by the injury or illness4
Occupation
Head
Total
cases
Trunk
Upper extremities
Finger
Hand,
except
finger
Wrist
Neck
Total
Eyes
Total
Back
Shoulder
Total
Arm
Total [1,078,140 cases] .........................................
113.3
7.7
2.9
1.7
38.5
23.4
7.8
25.7
5.1
10.0
4.4
4.9
Nursing aides, orderlies, and attendants ................
Laborers and freight, stock, and material movers,
hand ....................................................................
Emergency medical technicians and paramedics ..
Construction laborers .............................................
Truck drivers, heavy and tractor-trailer ..................
Reservation and transportation ticket agents and
travel clerks ..........................................................
Roofers ...................................................................
Cooks, institution and cafeteria ..............................
Truck drivers, light or delivery services ..................
Industrial machinery mechanics .............................
Food servers, nonrestaurant ..................................
Welders, cutters, solderers, and brazers ...............
Maids and housekeeping cleaners .........................
Automotive service technicians and mechanics .....
Taxi drivers and chauffeurs ....................................
Heating, air conditioning, and refrigeration
mechanics and installers ......................................
Janitors and cleaners, except maids and
housekeeping cleaners ........................................
Plumbers, pipefitters, and steamfitters ...................
Carpenters .............................................................
Butchers and meat cutters .....................................
Bus and truck mechanics and diesel engine
specialists .............................................................
Telecommunications line installers and repairers ..
Maintenance and repair workers, general ..............
Sheet metal workers ..............................................
Painters, construction and maintenance ................
449.0
14.9
4.5
7.7
228.8
163.6
37.5
58.7
17.3
9.7
7.0
19.6
440.3
387.0
383.1
362.0
29.9
4.4
27.3
25.0
11.1
–
12.1
5.6
5.0
8.1
2.5
6.2
158.6
215.0
128.1
144.7
91.1
157.3
75.0
73.0
33.0
36.5
19.1
39.5
99.9
71.1
87.2
51.5
20.1
46.8
14.6
18.0
41.1
8.0
40.0
12.0
19.5
1.3
21.6
9.8
15.7
14.9
7.7
9.0
353.8
349.2
330.7
323.8
299.9
298.4
292.1
277.7
254.2
251.8
10.2
15.2
13.0
14.6
25.8
26.8
58.2
16.4
41.7
11.7
1.6
6.3
5.5
2.7
10.9
5.4
48.1
5.6
16.8
1.3
5.7
5.0
1.4
8.2
3.4
3.0
2.3
2.3
2.3
17.8
161.2
105.5
95.0
129.6
125.2
94.9
75.0
97.9
65.6
102.8
109.9
74.7
52.0
79.9
73.6
61.1
38.3
62.4
34.8
77.0
26.0
11.1
32.5
25.6
13.6
22.9
14.3
20.5
12.7
13.6
58.4
100.0
138.5
45.1
67.7
70.4
78.3
59.5
89.7
21.0
15.0
21.8
25.4
10.3
11.7
14.3
17.8
12.9
9.7
10.4
15.4
59.8
55.4
15.2
33.4
29.6
35.4
16.1
46.6
2.4
16.0
7.6
19.2
6.4
12.2
15.9
7.2
9.8
19.7
2.8
11.7
9.0
31.6
11.1
8.4
8.4
10.9
14.7
11.9
4.7
243.9
32.8
15.6
1.3
88.6
58.9
18.8
50.1
6.7
15.1
18.1
7.8
243.0
241.4
235.7
234.2
14.9
28.9
18.4
14.7
7.0
18.8
9.9
4.7
7.3
2.1
1.2
–
93.8
95.1
70.5
68.5
58.4
69.3
42.2
28.0
16.5
15.0
11.2
13.5
48.1
38.3
63.7
113.9
9.7
7.8
10.7
7.6
21.7
18.2
31.9
84.6
7.5
7.5
12.7
11.9
7.3
2.3
6.6
7.9
230.6
230.6
212.7
211.7
209.9
51.2
11.1
20.7
12.6
17.2
22.8
3.3
10.0
7.1
15.0
3.9
7.4
4.0
4.7
2.6
82.4
80.7
73.3
66.8
63.9
37.7
53.8
40.7
41.1
34.6
12.6
21.0
14.0
15.6
17.3
33.4
33.7
51.7
80.8
58.0
7.6
12.2
8.4
7.6
11.5
14.3
5.6
23.6
44.0
15.1
7.4
6.1
8.6
9.6
6.6
2.8
6.2
8.3
19.3
24.3
See footnotes at end of table.
37
TABLE 21. Incidence rates1 for nonfatal occupational injuries and illnesses involving days away from work2 per 10,000 full-time
workers by selected worker occupation3 and selected parts of body, 2008 — Continued
Part of body affected by the injury or illness4
Lower extremities
Occupation
Multiple
body
parts
All
other
body
parts5
Total
Knee
Ankle
Total [1,078,140 cases] .........................................
25.3
9.7
5.8
5.2
1.7
11.8
1.0
Nursing aides, orderlies, and attendants ................
Laborers and freight, stock, and material movers,
hand ....................................................................
Emergency medical technicians and paramedics ..
Construction laborers .............................................
Truck drivers, heavy and tractor-trailer ..................
Reservation and transportation ticket agents and
travel clerks ..........................................................
Roofers ...................................................................
Cooks, institution and cafeteria ..............................
Truck drivers, light or delivery services ..................
Industrial machinery mechanics .............................
Food servers, nonrestaurant ..................................
Welders, cutters, solderers, and brazers ...............
Maids and housekeeping cleaners .........................
Automotive service technicians and mechanics .....
Taxi drivers and chauffeurs ....................................
Heating, air conditioning, and refrigeration
mechanics and installers ......................................
Janitors and cleaners, except maids and
housekeeping cleaners ........................................
Plumbers, pipefitters, and steamfitters ...................
Carpenters .............................................................
Butchers and meat cutters .....................................
Bus and truck mechanics and diesel engine
specialists .............................................................
Telecommunications line installers and repairers ..
Maintenance and repair workers, general ..............
Sheet metal workers ..............................................
Painters, construction and maintenance ................
73.9
37.0
15.6
11.0
3.5
57.9
3.6
112.6
43.3
104.2
82.7
33.3
22.0
31.5
31.4
21.5
13.8
24.9
21.1
33.0
3.3
28.8
12.2
2.9
8.2
5.2
2.4
27.4
25.5
26.9
45.7
4.1
11.6
1.7
3.7
94.1
79.9
45.7
81.5
58.6
65.5
54.7
59.7
38.9
36.6
31.0
25.5
21.1
30.0
32.8
21.8
22.7
26.0
14.0
17.2
24.0
18.2
9.3
22.9
6.3
19.6
6.3
17.5
9.8
7.0
28.9
21.9
8.9
11.2
8.1
14.4
16.7
5.9
7.5
3.5
2.3
–
2.3
2.2
2.2
2.2
2.1
6.8
1.0
5.9
21.7
39.3
33.3
37.8
16.8
33.6
20.1
33.8
13.7
55.6
–
3.5
1.5
4.7
–
2.0
1.5
1.2
1.4
–
41.5
19.5
8.1
6.3
3.1
24.7
1.9
47.2
53.8
55.1
27.4
17.6
30.0
20.3
9.2
10.7
5.5
10.6
6.2
11.6
6.7
13.1
8.5
4.6
1.8
1.1
–
24.8
20.7
24.4
5.7
2.4
.6
1.3
3.6
43.3
62.0
45.0
31.5
49.0
16.2
33.5
21.7
11.3
19.4
6.2
17.0
8.5
7.6
18.7
9.0
2.9
10.2
4.6
3.7
.9
3.0
2.4
–
1.6
14.2
31.3
14.7
14.1
17.2
1.2
1.4
1.0
1.1
–
1 Incidence rates represent the number of injuries and illnesses per
10,000 full-time workers and were calculated as: (N/EH) x 20,000,000
where
N
EH
= number of injuries and illnesses
= total hours worked by all employees
during the calendar year
20,000,000
= base for 10,000 equivalent full-time workers
(working 40 hours per week, 50 weeks per
year)
Foot, toe
Body
systems
codes: Head, Total = 00-09; Eyes = 032; Neck = 10-19; Trunk, Total =
20-29; Back = 23; Shoulder = 21; Upper extremities, Total = 30-39; Arm =
31; Finger = 34; Hand, except finger = 33; Wrist = 32; Lower extremities,
Total = 40-49; Knee = 412; Ankle = 42; Foot, toe = 43, 44; Body systems =
5; Multiple body parts = 8; All other body parts = remaining codes,
including 9999 (Nonclassifiable).
These codes are based on the
Occupational Injury and Illness Classification System developed by the
Bureau of Labor Statistics.
5 Includes nonclassifiable responses.
NOTE: Dash indicates data do not meet publication guidelines.
Because of rounding and data exclusion of nonclassifiable responses, data
may not sum to the totals.
SOURCE: Bureau of Labor Statistics, U.S. Department of Labor,
Survey of Occupational Injuries and Illnesses in cooperation with
participating State agencies
2
Days-away-from-work cases include those that resulted in days away
from work, some of which also included job transfer or restriction.
3 These occupations have at least 0.1% of full-time equivalent
employment.
4 Data shown in columns correspond to the following Part of body
38
TABLE 22. Incidence rates1 for nonfatal occupational injuries and illnesses involving days away from work2 per 10,000
full-time workers by selected worker occupation3 and selected sources of injury or illness, 2008
Source of injury or illness4
Occupation
Total
cases
Chemicals
and
chemical
products
Containers
Furniture
and
fixtures
Machinery
Parts
and
materials
Floors,
walkways
or
ground
surfaces
Total [1,078,140 cases] .........................................
113.3
1.6
13.7
4.4
6.7
11.2
22.8
Nursing aides, orderlies, and attendants ................
Laborers and freight, stock, and material movers,
hand ....................................................................
Emergency medical technicians and paramedics ..
Construction laborers .............................................
Truck drivers, heavy and tractor-trailer ..................
Reservation and transportation ticket agents and
travel clerks ..........................................................
Roofers ...................................................................
Cooks, institution and cafeteria ..............................
Truck drivers, light or delivery services ..................
Industrial machinery mechanics .............................
Food servers, nonrestaurant ..................................
Welders, cutters, solderers, and brazers ...............
Maids and housekeeping cleaners .........................
Automotive service technicians and mechanics .....
Taxi drivers and chauffeurs ....................................
Heating, air conditioning, and refrigeration
mechanics and installers ......................................
Janitors and cleaners, except maids and
housekeeping cleaners ........................................
Plumbers, pipefitters, and steamfitters ...................
Carpenters .............................................................
Butchers and meat cutters .....................................
Bus and truck mechanics and diesel engine
specialists .............................................................
Telecommunications line installers and repairers ..
Maintenance and repair workers, general ..............
Sheet metal workers ..............................................
Painters, construction and maintenance ................
449.0
2.4
6.6
18.4
5.9
1.3
77.5
440.3
387.0
383.1
362.0
4.4
7.2
3.7
3.4
116.3
2.4
20.2
39.1
21.5
13.2
2.6
3.4
25.8
–
20.1
9.4
52.2
10.0
97.5
43.0
55.5
30.6
67.8
82.2
353.8
349.2
330.7
323.8
299.9
298.4
292.1
277.7
254.2
251.8
1.6
2.1
5.1
1.0
5.3
5.3
1.8
6.5
6.2
–
140.9
43.6
65.1
66.9
25.0
52.4
13.9
28.2
10.6
23.5
7.1
–
10.7
12.2
3.9
14.5
4.0
35.6
2.3
–
7.2
10.2
14.2
7.6
51.1
13.5
30.9
7.2
11.7
–
3.7
58.3
2.7
25.5
57.1
9.0
91.2
2.7
72.7
2.3
51.5
74.1
93.8
57.3
37.2
82.0
25.8
76.5
26.9
47.4
243.9
10.0
11.5
3.0
25.6
41.8
42.9
243.0
241.4
235.7
234.2
5.9
3.4
.7
–
34.5
11.6
7.8
55.3
20.9
11.4
6.5
1.8
12.3
25.9
11.2
60.3
14.6
49.0
84.7
2.5
58.3
38.0
37.5
28.5
230.6
230.6
212.7
211.7
209.9
4.2
–
3.7
–
9.4
7.5
16.7
13.7
3.5
11.0
13.3
2.7
10.8
3.0
4.2
3.7
9.3
27.9
13.9
9.0
52.0
15.4
30.5
68.0
10.2
22.5
49.6
37.8
34.1
64.4
See footnotes at end of table.
39
TABLE 22. Incidence rates1 for nonfatal occupational injuries and illnesses involving days away from work2 per 10,000
full-time workers by selected worker occupation3 and selected sources of injury or illness, 2008 — Continued
Source of injury or illness4
Person, injured or ill worker
Occupation
Handtools
Total
Worker
motion
or
position
Vehicles
Person, other than
injured or ill worker
Total
Health
care
patient
All
other
sources5
Total [1,078,140 cases] .........................................
5.3
9.6
16.4
15.7
6.5
5.2
14.9
Nursing aides, orderlies, and attendants ................
Laborers and freight, stock, and material movers,
hand ....................................................................
Emergency medical technicians and paramedics ..
Construction laborers .............................................
Truck drivers, heavy and tractor-trailer ..................
Reservation and transportation ticket agents and
travel clerks ..........................................................
Roofers ...................................................................
Cooks, institution and cafeteria ..............................
Truck drivers, light or delivery services ..................
Industrial machinery mechanics .............................
Food servers, nonrestaurant ..................................
Welders, cutters, solderers, and brazers ...............
Maids and housekeeping cleaners .........................
Automotive service technicians and mechanics .....
Taxi drivers and chauffeurs ....................................
Heating, air conditioning, and refrigeration
mechanics and installers ......................................
Janitors and cleaners, except maids and
housekeeping cleaners ........................................
Plumbers, pipefitters, and steamfitters ...................
Carpenters .............................................................
Butchers and meat cutters .....................................
Bus and truck mechanics and diesel engine
specialists .............................................................
Telecommunications line installers and repairers ..
Maintenance and repair workers, general ..............
Sheet metal workers ..............................................
Painters, construction and maintenance ................
.9
7.5
42.5
41.8
247.9
241.2
38.0
15.0
–
38.9
6.0
50.0
33.4
26.9
91.7
51.5
53.4
41.1
52.0
49.7
47.2
39.8
49.2
1.0
175.4
.6
.6
–
146.1
–
–
47.2
60.0
63.8
31.1
–
34.6
26.5
6.8
22.0
15.2
33.1
4.4
28.5
–
64.9
19.4
4.2
72.7
21.7
17.9
7.1
11.4
39.4
114.2
43.0
39.0
47.6
47.1
42.8
38.2
32.6
57.0
25.8
17.1
42.7
35.2
46.5
43.5
42.4
36.9
32.4
52.3
24.5
13.9
4.3
–
–
.8
–
3.0
–
1.6
–
8.9
–
–
–
–
–
–
–
28.7
68.0
60.2
26.0
33.7
47.4
51.5
46.5
30.2
36.2
.8
–
4.7
12.4
11.8
46.0
45.8
–
–
38.7
13.6
24.1
16.9
39.8
13.6
8.0
6.2
7.7
32.1
37.2
31.9
18.3
30.8
36.8
29.9
18.1
1.3
–
–
–
–
–
–
–
35.9
32.7
32.1
19.5
35.7
7.5
18.4
20.6
7.6
29.2
25.0
13.8
4.5
7.1
33.1
47.2
29.4
27.4
36.2
32.5
47.0
28.9
27.3
36.0
3.1
2.9
.3
–
–
–
–
–
–
–
26.4
54.3
26.3
36.5
50.9
1 Incidence rates represent the number of injuries and illnesses per
10,000 full-time workers and were calculated as: (N/EH) x 20,000,000
where
N
EH
= number of injuries and illnesses
= total hours worked by all employees
during the calendar year
20,000,000
= base for 10,000 equivalent full-time workers
(working 40 hours per week, 50 weeks per
year)
Chemicals and chemical products = 00-09; Containers = 10-19; Furniture
and fixtures = 20-29; Machinery = 30-39; Parts and materials = 40-49;
Person, injured or ill worker = 56; Worker motion or position = 562;
Person, other than injured or ill worker = 57; Health care patient = 573;
Floors, walkways, or ground surfaces = 62; Handtools = 71-73; Vehicles
= 80-89; All other sources = all remaining codes, including 9999
(Nonclassifiable). These codes are based on the Occupational Injury
and Illness Classification System developed by the Bureau of Labor
Statistics.
5 Includes nonclassifiable responses.
NOTE: Dash indicates data do not meet publication guidelines.
Because of rounding and data exclusion of nonclassifiable responses,
data may not sum to the totals.
SOURCE: Bureau of Labor Statistics, U.S. Department of Labor,
Survey of Occupational Injuries and Illnesses in cooperation with
participating State agencies
2
Days-away-from-work cases include those that resulted in days
away from work, some of which also included job transfer or restriction.
3 These occupations have at least 0.1% of full-time equivalent
employment.
4 Data shown in columns correspond to the following Source codes:
40
TABLE 23. Incidence rates1 for nonfatal occupational injuries and illnesses involving days away from work2 per 10,000 full-time workers by
selected worker occupation3 and selected events or exposures leading to injury or illness, 2008
Event or exposure leading to injury or illness4
Contact with objects
Occupation
Total
cases
Total
Struck
by
object
Struck
against
object
Overexertion
Caught in or
compressed or
crushed
Fall
to
lower
level
Fall
on
same
level
Slips
or
trips
without
fall
Total
In lifting
Total [1,078,140 cases] .........................................
113.3
30.7
16.1
7.4
5.2
7.1
16.6
3.7
26.4
13.7
Nursing aides, orderlies, and attendants ................
Laborers and freight, stock, and material movers,
hand ....................................................................
Emergency medical technicians and paramedics ..
Construction laborers .............................................
Truck drivers, heavy and tractor-trailer ..................
Reservation and transportation ticket agents and
travel clerks ..........................................................
Roofers ...................................................................
Cooks, institution and cafeteria ..............................
Truck drivers, light or delivery services ..................
Industrial machinery mechanics .............................
Food servers, nonrestaurant ..................................
Welders, cutters, solderers, and brazers ...............
Maids and housekeeping cleaners .........................
Automotive service technicians and mechanics .....
Taxi drivers and chauffeurs ....................................
Heating, air conditioning, and refrigeration
mechanics and installers ......................................
Janitors and cleaners, except maids and
housekeeping cleaners ........................................
Plumbers, pipefitters, and steamfitters ...................
Carpenters .............................................................
Butchers and meat cutters .....................................
Bus and truck mechanics and diesel engine
specialists .............................................................
Telecommunications line installers and repairers ..
Maintenance and repair workers, general ..............
Sheet metal workers ..............................................
Painters, construction and maintenance ................
449.0
49.3
27.3
13.8
5.8
6.5
74.0
13.5
216.8
89.5
440.3
387.0
383.1
362.0
155.1
17.5
152.1
71.0
81.5
10.8
99.6
39.2
31.7
4.0
26.0
17.8
33.4
2.4
14.3
9.2
17.8
10.6
42.1
37.2
39.3
24.4
32.4
49.5
9.8
6.5
10.9
14.3
130.9
230.4
71.0
76.8
76.5
158.0
36.7
28.6
353.8
349.2
330.7
323.8
299.9
298.4
292.1
277.7
254.2
251.8
89.3
108.0
85.6
64.1
104.2
90.5
133.5
51.7
124.5
24.6
44.5
70.9
61.4
40.2
52.5
59.0
74.2
26.3
60.0
15.2
26.9
21.7
21.0
14.2
17.5
19.5
11.7
19.1
42.8
6.9
13.4
5.1
2.0
6.2
26.3
7.8
30.1
4.6
10.0
–
12.2
81.8
6.1
21.3
12.5
8.5
12.8
15.1
6.8
13.0
38.3
25.9
86.4
35.7
33.3
78.6
15.5
68.1
19.5
36.0
9.8
12.7
10.2
12.1
8.8
16.7
4.0
15.3
6.8
4.1
141.5
55.0
52.5
94.5
76.6
53.1
56.1
64.4
51.4
51.0
90.3
33.5
39.5
50.2
46.7
32.2
27.2
28.0
32.2
21.6
243.9
66.9
31.6
23.5
5.5
35.5
11.0
9.4
50.5
22.6
243.0
241.4
235.7
234.2
53.3
73.5
101.8
121.3
24.5
46.5
61.4
55.3
14.0
16.1
22.9
28.1
9.0
6.6
10.5
27.3
24.6
23.9
27.2
–
35.5
15.3
13.6
25.6
9.9
4.5
7.7
4.1
64.1
57.8
48.8
53.7
36.6
33.8
25.4
40.9
230.6
230.6
212.7
211.7
209.9
86.5
22.7
69.6
84.0
50.4
54.4
13.5
37.0
34.5
24.3
15.3
7.8
16.4
24.0
7.0
10.5
–
11.6
12.9
6.9
13.8
37.2
16.0
31.9
57.8
18.5
23.7
20.4
20.9
11.0
4.4
10.8
5.6
7.3
5.6
52.1
53.5
49.2
34.7
37.3
32.7
25.3
24.4
23.1
10.3
See footnotes at end of table.
41
TABLE 23. Incidence rates1 for nonfatal occupational injuries and illnesses involving days away from work2 per 10,000 full-time workers by selected
worker occupation3 and selected events or exposures leading to injury or illness, 2008 — Continued
Event or exposure leading to injury or illness4
Transportation accidents
Occupation
Repetitive
motion
Exposure to
harmful
substance or
environment
Total
Highway
accident
Assaults and violent acts
Fires
and
explosions
All other assaults
All
other
events5
By
person
Total
2.4
1.7
0.7
0.6
13.1
29.4
28.8
.6
.4
42.3
.5
.6
.5
45.9
52.4
41.7
45.9
Total
Assaults
by
animal
Total [1,078,140 cases] .........................................
3.2
4.8
5.1
3.1
0.2
Nursing aides, orderlies, and attendants ................
Laborers and freight, stock, and material movers,
hand ....................................................................
Emergency medical technicians and paramedics ..
Construction laborers .............................................
Truck drivers, heavy and tractor-trailer ..................
Reservation and transportation ticket agents and
travel clerks ..........................................................
Roofers ...................................................................
Cooks, institution and cafeteria ..............................
Truck drivers, light or delivery services ..................
Industrial machinery mechanics .............................
Food servers, nonrestaurant ..................................
Welders, cutters, solderers, and brazers ...............
Maids and housekeeping cleaners .........................
Automotive service technicians and mechanics .....
Taxi drivers and chauffeurs ....................................
Heating, air conditioning, and refrigeration
mechanics and installers ......................................
Janitors and cleaners, except maids and
housekeeping cleaners ........................................
Plumbers, pipefitters, and steamfitters ...................
Carpenters .............................................................
Butchers and meat cutters .....................................
Bus and truck mechanics and diesel engine
specialists .............................................................
Telecommunications line installers and repairers ..
Maintenance and repair workers, general ..............
Sheet metal workers ..............................................
Painters, construction and maintenance ................
2.2
11.6
3.4
3.0
–
8.8
1.8
3.4
2.9
10.5
12.6
12.7
7.3
18.9
24.3
14.2
55.0
3.1
21.2
4.8
40.5
2.1
–
1.8
.7
1.2
6.5
.9
1.4
.7
4.7
.3
.9
.6
1.9
.6
.5
4.0
6.1
23.6
5.2
3.8
5.0
9.5
7.5
2.9
–
1.7
15.2
46.0
2.6
12.0
20.7
31.1
9.1
11.9
4.8
23.9
8.7
–
39.4
15.0
2.3
1.5
2.5
6.4
101.7
–
7.1
–
30.2
12.2
–
–
.6
3.4
92.1
–
–
–
–
–
–
2.4
–
.9
–
–
–
1.4
3.5
–
1.8
–
3.1
2.6
3.7
–
–
–
1.1
–
1.7
–
.5
–
3.3
–
–
1.4
2.5
–
–
–
2.6
2.1
–
–
–
–
2.3
–
–
–
2.5
2.1
–
32.7
34.4
18.8
45.1
33.3
21.2
25.3
40.8
20.5
12.5
4.8
16.0
7.4
7.4
–
–
–
–
–
41.7
3.8
2.1
3.1
8.7
14.0
15.9
3.4
–
8.4
5.0
2.7
–
6.6
4.5
1.0
–
.7
3.9
–
5.5
2.2
.9
.2
–
1.0
–
–
–
1.2
.8
.2
–
1.2
.8
.2
–
26.3
38.6
27.2
10.7
1.9
5.2
5.6
4.4
10.5
13.2
9.1
10.8
2.0
11.9
4.4
22.9
9.1
1.5
1.2
2.1
22.6
6.2
1.4
1.0
1.6
–
.5
–
–
3.0
5.2
.8
–
–
3.0
2.7
.2
–
–
–
2.5
.6
–
–
–
1.8
.6
–
–
31.1
40.2
25.1
24.7
24.0
1 Incidence rates represent the number of injuries and illnesses per 10,000 full-time
workers and were calculated as: (N/EH) x 20,000,000 where
N
EH
= number of injuries and illnesses
= total hours worked by all employees
during the calendar year
20,000,000
= base for 10,000 equivalent full-time workers
(working
40
hours
per
week,
50
weeks
year)
–
Caught in or compressed or crushed = 030-049; Fall to lower level = 110-119; Fall on
same level = 130-139; Slips or trips without fall = 215; Overexertion, Total = 220-229; In
lifting = 221; Repetitive motion = 230-239; Exposure to harmful substance or
environment = 30-39; Transportation accidents = 40-49; Highway accident = 41; Fires
and explosions = 50-52; Assaults and violent acts, Total = 60-63; Assaults by person =
61; All other assaults = 60, 62, and 63; Assaults by animal = 63; All other events = all
remaining codes, including 9999 (Nonclassifiable). These codes are based on the
Occupational Injury and Illness Classification System developed by the Bureau of Labor
Statistics.
5 Includes nonclassifiable responses.
per
2 Days-away-from-work cases include those that resulted in days away from work,
some of which also included job transfer or restriction.
3 These occupations have at least 0.1% of full-time equivalent employment.
4 Data shown in columns correspond to the following Event codes: Contact with
objects, Total = 00-09; Struck by object = 020-029; Struck against object = 010-019;
NOTE: Dash indicates data do not meet publication guidelines. Because of rounding
and data exclusion of nonclassifiable responses, data may not sum to the totals.
SOURCE: Bureau of Labor Statistics, U.S. Department of Labor, Survey of
Occupational Injuries and Illnesses in cooperation with participating State agencies
42
© Copyright 2026 Paperzz