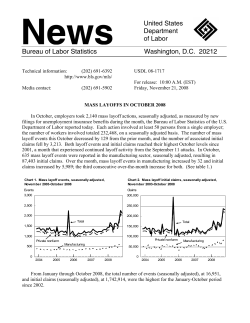
1
Technical information:
(202) 691-6392
http://www.bls.gov/mls/
Media contact:
USDL 07-0562
For release: 10:00 A.M. EDT
Friday, April 20, 2007
691-5902
MASS LAYOFFS IN MARCH 2007
In March, employers took 1,276 mass layoff actions, seasonally adjusted, as measured by new
filings for unemployment insurance benefits during the month, the Bureau of Labor Statistics of the U.S.
Department of Labor reported today. Each action involved at least 50 persons from a single establishment; the number of workers involved totaled 130,687, on a seasonally adjusted basis. The number of
mass layoff events decreased by 4 from the prior month, and the number of associated initial claims fell
by 13,290. During March, 420 mass layoff events were reported in the manufacturing sector, seasonally adjusted, resulting in 54,441 initial claims. Compared with the prior month, mass layoff events in
manufacturing remained about the same and initial claims decreased by 9,631. (See table 1.)
Chart 1. Mass layoff events, seasonally adjusted,
April 2002-March 2007
Chart 2. Mass layoff initial claims, seasonally adjusted,
April 2002-March 2007
Events
Claims
3,000
300,000
2,500
250,000
2,000
1,500
1,000
Total
200,000
Total
150,000
Private nonfarm
100,000
Manufacturing
Manufacturing
500
50,000
0
2003
2004
2005
2006
Private nonfarm
2007
0
2003
2004
2005
2006
2007
The national unemployment rate was 4.4 percent in March, essentially unchanged from 4.5 percent
the prior month and down from 4.7 percent a year earlier. Total nonfarm payroll employment increased
by 180,000 over the month and by 2.0 million over the year.
Industry Distribution (Not Seasonally Adjusted)
The 10 industries reporting the highest number of mass layoff initial claims, not seasonally adjusted,
accounted for 36 percent of the total initial claims in March. The industry with the highest number of
initial claims was temporary help services with 9,217, followed by food service contractors with 7,636,
and automobile manufacturing with 5,746. Together, these three industries accounted for 18 percent of
all initial claims due to mass layoffs during the month. (See table A.)
2
Table A. Industries with the largest number of mass layoff initial claims in March 2007
March peak
Industry
Temporary help services .......................................
Food service contractors ......................................
Automobile manufacturing .....................................
School and employee bus transportation ...............
Ship building and repairing ....................................
Motion picture and video production ....................
Discount department stores ...................................
Professional employer organizations ......................
Heavy duty truck manufacturing ............................
Motor vehicle body manufacturing ........................
1
Initial claims
9,217
7,636
5,746
4,305
3,961
3,758
3,670
2,716
(
1
)
1,981
Year
Initial claims
2002
2007
1996
2002
2007
2005
2007
2002
1996
2007
14,338
7,636
15,411
6,064
3,961
7,192
3,670
2,987
2,781
1,981
Data do not meet BLS or state agency disclosure standards.
The manufacturing sector accounted for 34 percent of all mass layoff events and 40 percent of all
related initial claims filed in March; a year earlier, manufacturing made up 31 percent of events and 40
percent of initial claims. In March 2007, the number of manufacturing claimants was highest in transportation equipment manufacturing (19,397, largely automobile manufacturing), followed by food
manufacturing (6,087) and wood product manufacturing (2,674). (See table 3.)
Administrative and waste services accounted for 13 percent of mass layoff events and 12 percent of
initial claims in March, mostly from temporary help services. Retail trade comprised 9 percent of events
and initial claims filed over the month, with the majority of layoffs in general merchandise stores. Eight
percent of all mass layoff events and 9 percent of related initial claims filed were from accommodation
and food services, primarily from food service contractors. Construction made up 10 percent of events
and 6 percent of associated initial claims, primarily from the heavy and civil engineering industry.
On a not seasonally adjusted basis, the number of mass layoff events in March at 1,082, was up by
161 from a year earlier, and the number of associated initial claims increased by 12,136 to 123,974.
(See table 2.) The largest over-the-year increases in initial claims were reported in transportation
equipment manufacturing (+4,439), general merchandise stores (+2,312), and professional and technical
services (+1,972). The largest over-the-year decreases in mass layoff initial claims were reported in
primary metal manufacturing (-1,691) and food manufacturing (-1,432).
Geographic Distribution (Not Seasonally Adjusted)
Among the four census regions, the highest number of initial claims in March due to mass layoffs
was in the West with 41,139. The administrative and support services, and motion picture and sound
recording industries together accounted for 29 percent of all mass layoff initial claims in that region during the month. The South had the second largest number of initial claims among the regions, 34,812,
followed by the Midwest, 33,410, and the Northeast, 14,613. (See table 5.)
3
The number of initial claimants in mass layoffs increased over the year in three of the four regions—
the South (+13,811), the West (+3,838), and the Northeast (+1,658). The Midwest region experienced the only decrease (-7,171). Five geographic divisions had over-the-year increases in the number of initial claims associated with mass layoffs, with the largest increases in the East South Central
(+10,418), the Pacific (+4,018), and the Middle Atlantic (+1,857). The division with the largest overthe-year decrease was the East North Central (-5,618).
Among the states, California recorded the highest number of initial claims filed due to mass layoff
events in March (33,172), followed by Illinois (8,754), Kentucky (6,623), Michigan (6,508), and Wisconsin (5,585). These five states accounted for 49 percent of all mass layoff events and associated
initial claims for unemployment insurance. (See table 6.)
Mississippi had the largest over-the-year increase in the number of initial claims (+4,288). States
having the next largest increases in initial claims were California (+3,645), Kentucky (+3,313), North
Carolina (+3,137), and Alabama (+2,713). The largest over-the-year decreases in claims occurred in
Michigan (-2,887) and Ohio (-2,512).
Note
The monthly data series in this release cover mass layoffs of 50 or more workers beginning in a
given month, regardless of the duration of the layoffs. For private nonfarm establishments, information
on the length of the layoff is obtained later and issued in a quarterly release that reports on mass layoffs
lasting more than 30 days (referred to as “extended mass layoffs”). The quarterly release provides
more information on the industry classification and location of the establishment and on the demographics of the laid-off workers. Because monthly figures include short-term layoffs of 30 days or less, the
sum of the figures for the 3 months in a quarter will be higher than the quarterly figure for mass layoffs
of more than 30 days. (See table 4.) See the Technical Note for more detailed definitions.
______________________________
The report on Extended Mass Layoffs in the First Quarter of 2007 is scheduled to be released on
Wednesday, May 16. The report on Mass Layoffs in April 2007 is scheduled to be released on
Wednesday, May 23.
Upcoming Changes to Extended Mass Layoff Data
As previously published in the Extended Mass Layoffs news release issued on
February 13, the collection and presentation of data on economic reasons for extended
mass layoffs will be improved. Clearer definitions and titles for many of the current
reasons will be introduced, and four new reasons will be added. Moreover, seven
higher-level categories—business demand, disaster/safety, financial, organizational, production, seasonal, and other/miscellaneous—will be used to aggregate and report the
detailed economic reasons for layoff.
For additional information on the changes to the MLS reasons, including detailed
definitions of each reason and a crosswalk of the old to the new reasons, please see
http://www. bls.gov/mls/home.htm or call (202) 691-6392.
Technical Note
The Mass Layoff Statistics (MLS) program is a federal-state
program that uses a standardized, automated approach to
identifying, describing, and tracking the effects of major job
cutbacks, using data from each state’s unemployment insurance
database. Each month, states report on establishments which
have at least 50 initial claims filed against them during a
consecutive 5-week period. These establishments then are
contacted by the state agency to determine whether these
separations lasted 31 days or longer, and, if so, other
information concerning the layoff is collected. States report on
layoffs lasting more than 1 month on a quarterly basis.
A given month contains an aggregation of the weekly
unemployment insurance claims filings for the Sunday through
Saturday weeks in that month. All weeks are included for the
particular month, except if the first day of the month falls on
Saturday. In this case, the week is included in the prior month’s
tabulations. This means that some months will contain 4 weeks
and others, 5 weeks, the number of weeks in a given month may
be different from year to year, and the number of weeks in a year
may vary. Therefore, analysis of over-the-month and over-theyear change in not seasonally adjusted series should take this
calendar effect into consideration.
The MLS program resumed operations in April 1995 after it
had been terminated in November 1992 due to lack of funding.
Prior to April 1995, monthly layoff statistics were not available.
Information in this release will be made available to sensory
impaired individuals upon request. Voice phone: 202-691-5200;
TDD message referral phone number: 1-800-877-8339.
Definitions
Initial claimant . A person who files any notice of
unemployment to initiate a request either for a determination of
entitlement to and eligibility for compensation, or for a
subsequent period of unemployment within a benefit year or
period of eligibility.
Mass layoff event. Fifty or more initial claims for
unemployment insurance benefits filed against an
establishment during a 5-week period, regardless of duration.
Seasonal adjustment
Effective with the release of data for January 2005, BLS
began publishing six seasonally adjusted monthly MLS series.
The six series are the numbers of mass layoff events and mass
layoff initial claims for the total, private nonfarm, and
manufacturing sectors.
Seasonal adjustment is the process of estimating and
removing the effect on time series data of regularly recurring
seasonal events such as changes in the weather, holidays, and
the beginning and ending of the school year. The use of
seasonal adjustment makes it easier to observe fundamental
changes in time series, particularly those associated with
general economic expansions and contractions.
The MLS data are seasonally adjusted using the X-12ARIMA seasonal adjustment method on a concurrent basis.
Concurrent seasonal adjustment uses all available monthly
estimates, including those for the current month, in developing
seasonal adjustment factors. Revisions to the most recent
5 years of seasonally adjusted data will be made once a
year with the issuance of December data. Before the data are
seasonally adjusted, prior adjustments are made to the
original data to adjust them for differences in the number of
weeks used to calculate the monthly data. Because weekly
unemployment insurance claims are aggregated to form
monthly data, a particular month’s value could be calculated
with 5 weeks of data in one year and 4 weeks in another. The effects of these differences could seriously distort
the seasonal factors if they were ignored in the seasonal
adjustment process. These effects are modeled in the X-12ARIMA program and are permanently removed from the final
seasonally adjusted series.
Table 1. Mass layoff events and initial claimants for unemployment insurance, April 2003 to March 2007,
seasonally adjusted
Total
Date
Events
Private nonfarm
Initial
claimants
Events
Initial
claimants
Manufacturing
Events
Initial
claimants
2003
April .........................................................................
May .........................................................................
June ........................................................................
July .........................................................................
August .....................................................................
September ..............................................................
October ...................................................................
November ...............................................................
December ...............................................................
1,707
1,731
1,733
1,649
1,498
1,562
1,536
1,366
1,412
172,348
184,479
164,442
164,146
169,799
147,054
158,137
138,079
139,423
1,557
1,550
1,523
1,443
1,362
1,370
1,328
1,223
1,243
162,117
170,984
147,609
148,650
156,687
132,262
140,298
126,597
127,356
634
635
638
567
546
479
420
377
445
82,756
87,049
68,976
72,023
74,509
57,332
52,105
49,716
50,923
2004
January ...................................................................
February .................................................................
March ......................................................................
April .........................................................................
May .........................................................................
June ........................................................................
July .........................................................................
August .....................................................................
September ..............................................................
October ...................................................................
November ...............................................................
December ...............................................................
1,428
1,320
1,372
1,374
1,209
1,403
1,330
1,394
1,277
1,288
1,314
1,170
146,692
134,626
139,716
140,190
113,091
141,048
137,484
127,671
125,351
132,250
130,558
114,641
1,232
1,170
1,237
1,202
1,047
1,231
1,180
1,224
1,154
1,172
1,171
1,013
128,191
122,329
130,737
124,962
99,615
128,137
126,106
113,376
115,343
122,831
118,904
103,434
394
367
401
349
330
366
372
345
338
362
378
301
45,544
40,849
59,987
38,197
38,965
47,015
51,424
36,963
46,955
47,571
46,276
33,022
2005
January ...................................................................
February .................................................................
March ......................................................................
April .........................................................................
May .........................................................................
June ........................................................................
July .........................................................................
August .....................................................................
September ..............................................................
October ...................................................................
November ...............................................................
December ...............................................................
1,489
1,172
1,219
1,263
1,226
1,194
1,248
1,109
2,217
1,098
1,167
1,253
160,986
123,377
132,035
137,381
133,221
126,834
131,500
123,125
292,177
108,665
115,803
135,721
1,353
1,045
1,079
1,132
1,085
1,074
1,101
986
1,998
977
1,036
1,125
150,640
112,752
122,013
126,747
120,899
117,712
118,800
111,879
246,227
99,402
104,576
124,632
383
358
377
398
382
359
353
338
419
321
330
372
56,133
45,794
55,061
60,826
54,886
57,018
47,136
46,915
56,289
44,666
43,307
48,592
2006
January ...................................................................
February .................................................................
March ......................................................................
April .........................................................................
May .........................................................................
June ........................................................................
July .........................................................................
August .....................................................................
September ..............................................................
October ...................................................................
November ...............................................................
December ...............................................................
1,112
1,065
1,105
1,175
1,098
1,130
1,160
1,218
1,158
1,186
1,220
1,201
109,429
112,742
120,954
121,376
113,195
123,558
118,843
131,105
120,795
119,914
136,340
133,818
984
973
1,003
1,041
982
1,007
1,038
1,083
1,043
1,069
1,111
1,099
99,277
105,055
112,730
111,369
103,839
113,037
109,509
120,923
111,876
111,036
127,286
124,526
282
329
335
365
297
331
372
367
392
401
411
390
29,911
46,548
50,149
48,038
42,993
40,500
49,069
58,983
46,802
55,795
60,599
53,828
2007
January ...................................................................
February .................................................................
March ......................................................................
1,237
1,280
1,276
126,368
143,977
130,687
1,095
1,166
1,165
115,615
135,252
122,150
389
419
420
51,141
64,072
54,441
Table 2. Mass layoff events and initial claimants for unemployment insurance, April 2003 to March 2007,
not seasonally adjusted
Total
Date
Events
Private nonfarm
Initial
claimants
Events
Initial
claimants
Manufacturing
Events
Initial
claimants
2003
April .........................................................................
May .........................................................................
June ........................................................................
July .........................................................................
August .....................................................................
September ..............................................................
October ...................................................................
November ...............................................................
December ...............................................................
1,581
1,703
1,691
2,087
1,258
868
1,523
1,438
1,929
161,412
174,204
157,552
226,435
133,839
82,647
158,240
138,543
192,633
1,470
1,538
1,336
1,815
1,163
756
1,265
1,234
1,793
152,937
160,729
127,743
206,901
124,131
73,914
137,706
123,524
182,750
499
499
389
946
405
271
438
408
648
62,349
61,278
40,845
136,410
52,620
31,428
53,741
48,419
77,915
2004
January ...................................................................
February .................................................................
March ......................................................................
April .........................................................................
May .........................................................................
June ........................................................................
July .........................................................................
August .....................................................................
September ..............................................................
October ...................................................................
November ...............................................................
December ...............................................................
2,428
941
920
1,458
988
1,379
2,094
809
708
1,242
1,399
1,614
239,454
84,201
92,554
157,314
87,501
134,588
253,929
69,033
68,972
127,918
130,423
161,271
2,226
832
847
1,316
878
1,077
1,860
745
637
1,101
1,201
1,487
220,687
76,577
87,782
142,657
78,786
110,804
234,877
63,876
63,102
117,375
115,549
152,092
848
240
258
343
219
222
885
194
189
372
412
436
89,551
23,043
34,686
36,172
22,141
27,307
145,895
17,698
25,808
48,265
44,243
50,726
2005
January ...................................................................
February .................................................................
March ......................................................................
April .........................................................................
May .........................................................................
June ........................................................................
July .........................................................................
August .....................................................................
September ..............................................................
October ...................................................................
November ...............................................................
December ...............................................................
2,564
810
806
1,373
986
1,157
1,981
645
1,662
905
1,254
2,323
263,952
74,644
88,937
158,582
101,358
120,463
244,216
67,582
213,281
91,941
116,127
254,258
2,421
722
733
1,263
891
941
1,745
598
1,505
757
1,079
2,168
253,409
68,372
83,793
148,133
93,332
103,307
222,377
63,484
179,042
80,694
102,182
242,753
823
230
246
395
249
216
856
188
318
249
363
706
108,985
24,931
33,030
59,129
30,424
32,783
136,210
22,531
47,497
37,276
41,442
96,382
2006
January ...................................................................
February .................................................................
March ......................................................................
April .........................................................................
May .........................................................................
June ........................................................................
July .........................................................................
August .....................................................................
September ..............................................................
October ...................................................................
November ...............................................................
December ...............................................................
1,245
719
921
1,140
872
1,489
1,511
708
865
964
1,315
2,249
117,946
66,555
111,838
121,589
84,809
164,761
166,857
72,844
87,699
98,804
136,186
254,503
1,123
658
856
1,038
794
1,224
1,335
656
785
820
1,172
2,126
108,701
62,208
106,177
112,964
78,663
140,687
154,342
69,054
81,274
88,133
125,009
244,783
331
210
285
296
192
319
648
203
296
311
455
735
35,097
24,892
44,688
39,538
23,570
41,095
96,152
28,494
39,076
46,737
58,473
105,462
2007
January ...................................................................
February .................................................................
March ......................................................................
1,407
935
1,082
134,984
86,696
123,974
1,263
861
1,015
124,475
82,097
118,431
456
273
367
53,615
36,170
49,886
Table 3. Industry distribution: Mass layoff events and initial claimants for unemployment insurance
Initial claimants for
unemployment insurance
Mass layoff events
Industry
March
January
February
March
March
January
February
March
2006
2007
2007
2007
2006
2007
2007
2007
Total ......................................................................
1,105
1,237
1,280
1,276
120,954
126,368
143,977
130,687
Total, private nonfarm ...............................................
Manufacturing .........................................................
1,003
335
1,095
389
1,166
419
1,165
420
112,730
50,149
115,615
51,141
135,252
64,072
122,150
54,441
Total ....................................................................
921
1,407
935
1,082
111,838
134,984
86,696
123,974
Total, private ...............................................................
Agriculture, forestry, fishing and hunting ................
897
41
1,344
81
913
52
1,046
31
109,302
3,125
129,715
5,240
85,170
3,073
120,544
2,113
856
1,263
10
861
1,015
106,177
118,431
(2)
(2)
107
367
67
7
16
4
15
–
30
10
8
–
(2)
(2)
9,007
44,688
7,519
776
951
124,475
769
82,097
(2)
(2)
203
273
40
4
6
4
5
(2)
(2)
13,191
36,170
4,188
280
998
383
286
( )
2,430
668
616
–
( )
4,342
572
1,110
2
( )
4,497
397
358
(2)
(2)
(2)
(2)
7,815
49,886
6,087
778
1,882
350
1,355
–
2,674
779
637
–
Seasonally adjusted
Not seasonally adjusted
1
Total, private nonfarm ...............................................
Mining .....................................................................
Utilities ....................................................................
Construction ............................................................
Manufacturing .........................................................
Food ....................................................................
Beverage and tobacco products .........................
Textile mills .........................................................
Textile product mills ............................................
Apparel ...............................................................
Leather and allied products ................................
Wood products ....................................................
Paper ..................................................................
Printing and related support activities .................
Petroleum and coal products ..............................
(2)
(2)
123
285
73
7
8
(2)
10
2
(2)
194
456
59
6
16
9
12
2
2
(2)
1,012
2
(2)
12,426
53,615
4,525
456
1,703
1,132
1,020
2
( )
18
7
9
–
( )
46
7
13
( )
47
7
4
(2)
(2)
Chemicals ...........................................................
Plastics and rubber products ..............................
Nonmetallic mineral products .............................
Primary metals ....................................................
Fabricated metal products ..................................
Machinery ...........................................................
5
15
12
11
9
20
9
22
28
13
32
24
4
9
24
13
14
17
5
18
16
17
14
11
436
1,492
837
3,667
894
2,024
771
1,513
2,059
1,687
2,581
2,309
348
469
1,624
1,411
1,315
2,946
310
1,682
1,483
1,976
1,567
2,013
Computer and electronic products ......................
Electrical equipment and appliances ..................
Transportation equipment ...................................
Furniture and related products ............................
Miscellaneous manufacturing .............................
11
11
42
5
7
15
8
104
23
6
9
4
43
15
(2)
26
15
68
16
4
1,296
3,570
14,958
436
712
1,351
514
22,315
2,948
454
667
281
14,510
994
(2)
2,562
2,502
19,397
1,571
281
Wholesale trade ......................................................
Retail trade .............................................................
Transportation and warehousing ............................
Information ..............................................................
Finance and insurance ...........................................
Real estate and rental and leasing .........................
Professional and technical services ........................
Management of companies and enterprises ...........
Administrative and waste services ..........................
Educational services ...............................................
Health care and social assistance ..........................
Arts, entertainment, and recreation ........................
Accommodation and food services .........................
Other services, except public administration ..........
Unclassified ...........................................................
11
65
47
28
22
5
22
(2)
120
(2)
18
14
79
2
( )
7
22
112
88
32
29
6
28
(2)
172
5
14
26
56
8
2
5
71
40
24
21
4
25
(2)
114
4
18
5
42
5
1
17
93
55
30
39
7
29
5
140
4
16
10
86
6
–
688
7,315
6,326
5,779
1,610
411
2,467
(2)
14,361
(2)
1,167
1,187
9,792
2
( )
556
1,603
9,587
9,275
6,296
2,197
307
3,088
(2)
16,699
647
776
1,897
4,124
772
104
278
5,869
4,254
2,966
1,511
275
2,403
(2)
9,156
322
1,099
289
3,555
310
71
1,828
11,407
5,896
4,843
2,883
400
4,391
324
15,153
192
1,160
680
10,895
364
–
Government ................................................................
Federal ....................................................................
State .......................................................................
Local .......................................................................
24
6
7
11
63
21
15
27
22
5
6
11
36
6
11
19
2,536
757
844
935
5,269
2,311
1,272
1,686
1,526
339
482
705
3,430
501
820
2,109
1
Data were reported by all states and the District of Columbia.
2
Data do not meet BLS or state agency disclosure standards.
NOTE: Dash represents zero.
Table 4. Mass layoff events and initial claimants for unemployment insurance, January 2005 to March 2007,
not seasonally adjusted
Private nonfarm
Total mass layoffs
Mass layoffs
Date
Events
Initial
claimants
Events
Initial
claimants
2005
January ..............................................
February .............................................
March .................................................
2,564
810
806
263,952
74,644
88,937
2,421
722
733
253,409
68,372
83,793
First Quarter .......................................
4,180
427,533
3,876
405,574
April ....................................................
May ....................................................
June ...................................................
1,373
986
1,157
158,582
101,358
120,463
1,263
891
941
148,133
93,332
103,307
Second Quarter ..................................
3,516
380,403
3,095
344,772
July .....................................................
August ................................................
September .........................................
1,981
645
1,662
244,216
67,582
213,281
1,745
598
1,505
222,377
63,484
179,042
Third Quarter ......................................
4,288
525,079
3,848
464,903
October ..............................................
November ..........................................
December ..........................................
905
1,254
2,323
91,941
116,127
254,258
757
1,079
2,168
80,694
102,182
242,753
Fourth Quarter ...................................
4,482
462,326
4,004
425,629
January ..............................................
February .............................................
March .................................................
1,245
719
921
117,946
66,555
111,838
1,123
658
856
108,701
62,208
106,177
First Quarter .......................................
2,885
296,339
2,637
277,086
April ....................................................
May ....................................................
June ...................................................
1,140
872
1,489
121,589
84,809
164,761
1,038
794
1,224
112,964
78,663
140,687
Second Quarter ..................................
3,501
371,159
3,056
332,314
July .....................................................
August ................................................
September .........................................
1,511
708
865
166,857
72,844
87,699
1,335
656
785
154,342
69,054
81,274
Third Quarter ......................................
3,084
327,400
2,776
304,670
October ..............................................
November ..........................................
December ..........................................
964
1,315
2,249
98,804
136,186
254,503
820
1,172
2,126
88,133
125,009
244,783
Fourth Quarter ...................................
4,528
489,493
4,118
457,925
January ..............................................
February .............................................
March .................................................
1,407
935
1,082
134,984
86,696
123,974
1,263
861
1,015
124,475
82,097
118,431
First Quarter .......................................
3,424
345,654
3,139
325,003
Extended mass layoffs
lasting more than 30 days
Events
Initial
claimants
1
Realization rates
Events
Initial
claimants
1,142
185,486
29.5
45.7
1,203
212,673
38.9
61.7
1,136
190,186
29.5
40.9
1,400
246,188
35.0
57.8
963
193,102
36.5
69.7
1,353
264,494
44.3
79.6
929
160,813
33.5
52.8
2006
2,p
1,444
2,p
217,742
p
35.1
p
47.5
2007
1
The event realization rate is the percentage of all private nonfarm
data on these layoffs become available. Experience suggests that the
mass layoff events lasting more than 30 days. The initial claimant realization
number of extended mass layoff events is generally revised upwards
rate is the percentage of all private nonfarm mass layoff initial claimants
by less than 10 percent and the number of initial claimants associated
associated with layoffs lasting more than 30 days.
2
These quarterly numbers are provisional and will be revised as more
with such events increases by 25-40 percent.
p
= preliminary.
Table 5. Mass layoff events and initial claimants for unemployment insurance by census region and division,
not seasonally adjusted
Initial claimants for
unemployment insurance
Mass layoff events
Census region and division
March
2006
January
2007
February
2007
March
2007
March
2006
January
2007
February
2007
March
2007
United States1 .....................................................
921
1,407
935
1,082
111,838
134,984
86,696
123,974
Northeast ....................................................................
124
299
179
137
12,955
25,463
18,272
14,613
New England ..........................................................
Middle Atlantic ........................................................
22
102
41
258
25
154
17
120
1,849
11,106
3,349
22,114
2,602
15,670
1,650
12,963
South ..........................................................................
176
283
168
238
21,001
29,870
17,850
34,812
South Atlantic .........................................................
East South Central .................................................
West South Central ................................................
95
39
42
163
71
49
84
42
42
115
77
46
11,298
4,819
4,884
14,996
9,489
5,385
9,938
4,336
3,576
13,072
15,237
6,503
Midwest ......................................................................
259
373
239
283
40,581
38,412
26,603
33,410
East North Central ..................................................
West North Central .................................................
199
60
295
78
198
41
225
58
32,836
7,745
31,681
6,731
23,364
3,239
27,218
6,192
West ...........................................................................
362
452
349
424
37,301
41,239
23,971
41,139
Mountain .................................................................
Pacific .....................................................................
34
328
46
406
25
324
41
383
3,380
33,921
3,508
37,731
1,833
22,138
3,200
37,939
1
See footnote 1, table 3.
Alabama, Kentucky, Mississippi, and Tennessee; West South Central: Arkansas,
NOTE: The States (including the District of Columbia) that comprise
Louisiana, Oklahoma, and Texas; East North Central: Illinois, Indiana, Michigan,
the census divisions are: New England: Connecticut, Maine,
Massachusetts, New Hampshire, Rhode Island, and Vermont; Middle
Atlantic: New Jersey, New York, and Pennsylvania; South Atlantic:
Delaware, District of Columbia, Florida, Georgia, Maryland, North
Carolina, South Carolina, Virginia, and West Virginia; East South Central:
Ohio, and Wisconsin; West North Central: Iowa, Kansas, Minnesota, Missouri,
Nebraska, North Dakota, and South Dakota; Mountain: Arizona, Colorado, Idaho,
Montana, Nevada, New Mexico, Utah, and Wyoming; and Pacific: Alaska,
California, Hawaii, Oregon, and Washington.
Table 6. State distribution: Mass layoff events and initial claimants for unemployment insurance,
not seasonally adjusted
Initial claimants for
unemployment insurance
Mass layoff events
State
March
2006
Total1 .......................................................................
Alabama .....................................................................
Alaska .........................................................................
Arizona .......................................................................
Arkansas ....................................................................
California ....................................................................
Colorado .....................................................................
Connecticut ................................................................
Delaware ....................................................................
District of Columbia ....................................................
Florida ........................................................................
Georgia .......................................................................
Hawaii .........................................................................
Idaho ..........................................................................
Illinois .........................................................................
Indiana ........................................................................
Iowa ............................................................................
Kansas .......................................................................
Kentucky .....................................................................
Louisiana ....................................................................
Maine ..........................................................................
Maryland .....................................................................
Massachusetts ...........................................................
Michigan .....................................................................
Minnesota ...................................................................
Mississippi ..................................................................
Missouri ......................................................................
Montana .....................................................................
Nebraska ....................................................................
Nevada .......................................................................
New Hampshire ..........................................................
New Jersey .................................................................
New Mexico ................................................................
New York ....................................................................
North Carolina ............................................................
North Dakota ..............................................................
Ohio ............................................................................
Oklahoma ...................................................................
Oregon .......................................................................
Pennsylvania ..............................................................
Rhode Island ..............................................................
South Carolina ............................................................
South Dakota ..............................................................
Tennessee ..................................................................
Texas ..........................................................................
Utah ............................................................................
Vermont ......................................................................
Virginia .......................................................................
Washington ................................................................
West Virginia ..............................................................
Wisconsin ...................................................................
Wyoming ....................................................................
Puerto Rico .................................................................
921
January
2007
6
2
86,696
123,974
19
16
–
26
–
6
660
–
804
189
29,527
1,792
1,757
–
3,373
–
362
4
2
( )
366
11
8
2
44
20
7
6
21
8
48
38
15
11
27
7
7
11
16
88
15
3
34
(2)
5
4
50
10
(2)
31
2
( )
5
2
( )
2
( )
299
(2)
2
( )
2
( )
–
39
15
–
10
2
( )
333
4
2
( )
–
–
51
14
4
8
44
21
14
54
19
11
4
32
5
3
6
4
51
15
10
22
(2)
16
8
(2)
8
7
38
9
4
14
(2)
(2)
390
( )
2
( )
3,537
4,802
562
646
7,478
2,559
1,866
751
3,310
520
5,524
3,388
1,772
689
6,086
1,891
495
1,000
1,235
7,914
1,474
236
2,593
(2)
497
253
9,395
882
(2)
3,297
(2)
7
6
(2)
38
(2)
113
10
(2)
27
4
20
5
(2)
32
6
22
51
(2)
61
7
20
107
(2)
41
13
12
107
(2)
43
4
30
45
(2)
6,956
966
2,430
5,723
7
14
7
7
(2)
(2)
2
( )
2
2
( )
17
1
See footnote 1, table 3.
2
Data do not meet BLS or state agency disclosure standards.
–
( )
(2)
22
33
7
2
–
6
20
–
4
8
13
10
(2)
9
35
(2)
4
10
16
( )
17
14
–
60
–
( )
54
–
( )
58
12
8
15
2
2
( )
33,560
818
819
( )
–
4,033
1,880
814
523
(2)
15
3
36
8
2
2
( )
409
2
4
3
11
3
35
6
40
22
( )
53
March
2007
134,984
( )
2
( )
60
48
5
10
10
–
10
25
4
8
6
14
February
2007
111,838
( )
–
44
20
9
7
5
9
January
2007
1,082
2
(2)
March
2006
935
( )
7
3
283
March
2007
1,407
7
–
February
2007
2
4,684
1,963
1,469
(2)
1,333
492
(2)
747
442
6,507
615
254
801
(2)
2
( )
–
–
4,562
1,635
323
537
8,754
1,927
1,285
930
6,623
446
233
462
268
6,508
1,231
4,428
2,347
( )
547
–
638
(2)
1,817
161
3,566
849
(2)
2,737
(2)
10,678
1,013
(2)
2,558
229
2,184
518
319
218
842
462
3,529
548
4,636
3,986
(2)
8,883
436
2,006
8,699
(2)
4,175
1,377
1,264
10,928
(2)
4,444
1,178
3,272
4,798
489
1,466
1,249
641
–
992
1,656
–
240
3,476
1,065
2
(2)
1,375
2,845
494
2
2
( )
6,448
2
( )
( )
1,706
1,528
–
5,972
–
1,742
1,257
( )
(2)
2
( )
2
( )
–
2,616
1,831
–
615
2
( )
33,172
458
774
1,251
1,359
–
709
3,209
274
848
805
1,150
452
2
( )
2
( )
19,809
2
2
NOTE: Dash represents zero.
2
(2)
1,210
(2)
813
4,762
(2)
465
1,091
1,172
2
( )
6,035
–
( )
5,585
535
1,355
2
( )
© Copyright 2026 Paperzz