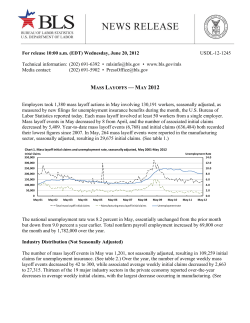
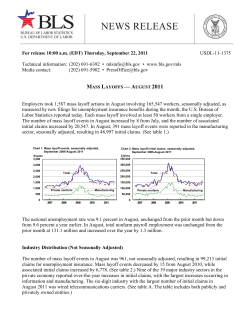
USDL-12-1018
For release 10:00 a.m. (EDT) Tuesday, May 22, 2012
Technical information: (202) 691-6392 • [email protected] • www.bls.gov/mls
Media contact:
(202) 691-5902 • [email protected]
MASS LAYOFFS — APRIL 2012
Employers took 1,388 mass layoff actions in April involving 135,600 workers, seasonally adjusted, as
measured by new filings for unemployment insurance benefits during the month, the U.S. Bureau of
Labor Statistics reported today. Each mass layoff involved at least 50 workers from a single employer.
Mass layoff events in April increased by 115 from March, and the number of associated initial claims
increased by 14,290. In April, 287 mass layoff events were reported in the manufacturing sector,
seasonally adjusted, resulting in 33,243 initial claims. (See table 1.)
Chart 1. Mass layoff initial claims and unemployment rate, seasonally adjusted, April 2001‐April 2012 Unemployment Rate
14.0
Initial Claims
350,000
300,000
12.0
250,000
10.0
200,000
8.0
150,000
6.0
100,000
4.0
50,000
2.0
0
Apr‐01
Apr‐02
Apr‐03
Apr‐04
Total mass layoff initial claims
Apr‐05
Apr‐06
Apr‐07
Apr‐08
Manufacturing mass layoff initial claims
Apr‐09
Apr‐10
Apr‐11
0.0
Apr‐12
Unemployment rate
The national unemployment rate was 8.1 percent in April, little changed from the prior month but down
from 9.0 percent a year earlier. Total nonfarm payroll employment increased by 115,000 over the month
and by 1,816,000 over the year.
Industry Distributions (Not Seasonally Adjusted)
The number of mass layoff events in April was 1,421, not seasonally adjusted, resulting in 146,358
initial claims for unemployment insurance. (See table 2.) Over the year, the number of average weekly
mass layoff events increased by 5 to 355, while associated average weekly initial claims decreased by
1,394 to 36,590. Ten of the 19 major industry sectors in the private economy reported over-the-year
decreases in average weekly initial claims, with the largest decrease occurring in manufacturing. (See
table 3.) In April, the six-digit industry with the largest number of private nonfarm initial claims was
school and employee bus transportation. (See table A.)
Table A. Six-digit NAICS industries with the largest number of mass layoff initial claims
in April 2012, private nonfarm, not seasonally adjusted
April peak
Industry
Initial Claims
Year
Initial claims
School and employee bus transportation ...................
1
Temporary help services ........................................
Food service contractors ..........................................
Tax preparation services ...........................................
Motor vehicle metal stamping ...................................
Hotels and motels, except casino hotels ....................
Educational support services .....................................
Discount department stores ......................................
Motion picture and video production ........................
Tire manufacturing, except retreading ........................
1
2
20,482
10,285
8,561
4,528
(2)
2,388
2,381
2,301
2,201
(2)
2011
2001
2011
2010
2012
2010
2012
2009
1997
2009
23,573
17,507
10,948
6,514
(2)
4,130
2,381
4,462
15,908
2,376
See the Technical Note for more information on these industries.
Data do not meet BLS or state agency disclosure standards.
In April, the manufacturing sector accounted for 19 percent of mass layoff events and 23 percent of
associated initial claims in the private economy. Within manufacturing, the numbers of mass layoff
claimants were highest in food and in transportation equipment. Thirteen of the 21 manufacturing
subsectors experienced over-the-year decreases in average weekly initial claims, with the largest
decrease occurring in transportation equipment. (See table 3.)
Geographic Distribution (Not Seasonally Adjusted)
Among the census regions, the Northeast registered the largest number of initial claims in April. Two of
the 4 regions experienced over-the-year decreases in average weekly initial claims, with the largest
decrease occurring in the Midwest. (See table 4.)
Among the states, California recorded the highest number of mass layoff initial claims in April,
followed by New York, New Jersey, Pennsylvania, and Illinois. Twenty-six states and the District of
Columbia experienced over-the-year decreases in average weekly initial claims, led by Ohio, Kentucky,
Michigan, and Wisconsin. (See table 4.)
Note
The monthly data series in this release cover mass layoffs of 50 or more workers beginning in a given
month, regardless of the duration of the layoffs. For private nonfarm establishments, information on the
length of the layoff is obtained later and issued in a quarterly release that reports on mass layoffs lasting
more than 30 days (referred to as “extended mass layoffs”). The quarterly release provides more
information on the industry classification and location of the establishment and on the demographics of
the laid-off workers. The monthly data series in this release are subjected to average weekly analysis,
-2-
which mitigates the effect of differing lengths of months. See the Technical Note for more detailed
definitions and for a description of average weekly analysis.
____________
The Mass Layoffs news release for May is scheduled to be released on Wednesday, June 20, 2012,
at 10:00 a.m. (EDT).
-3-
Technical Note
The Mass Layoff Statistics (MLS) program is a federalstate program that uses a standardized automated approach to
identifying, describing, and tracking the effects of major job
cutbacks, using data from each state's unemployment
insurance database. Each month, states report on employers
which have at least 50 initial claims filed against them during
a consecutive 5-week period. These employers then are
contacted by the state agency to determine whether these
separations lasted 31 days or longer, and, if so, other
information concerning the layoff is collected. States report
on layoffs lasting more than 1 month on a quarterly basis.
A given month contains an aggregation of the weekly
unemployment insurance claims filings for the Sunday
through Saturday weeks in that month. All weeks are
included for the particular month, except if the first day of the
month falls on Saturday. In this case, the week is included in
the prior month's tabulations. This means that some months
will contain 4 weeks and others, 5 weeks. The number of
weeks in a given month may be different from year to year,
and the number of weeks in a year may vary. Therefore, data
users who intend to perform analysis of over-the-year change
in the not seasonally adjusted series should use the average
weekly mass layoff figures displayed in tables 3 and 4 of this
release. The average weekly adjustment process produces a
consistent series for each month across all years, permitting
over-the-year analysis to be performed using strictly
comparable data.
The MLS program resumed operations in April 1995
after it had been terminated in November 1992 due to lack of
funding. Prior to April 1995, monthly layoff statistics were
not available.
Information in this release will be made available to
sensory impaired individuals upon request. Voice phone:
(202) 691-5200; Federal Relay Service: (800) 877-8339
Definitions
Average weekly mass layoff events and initial claimants.
The number of events and initial claimants in a given month
divided by the number of weeks contained within that month.
Employer. Employers in the MLS program include
those covered by state unemployment insurance laws.
Information on employers is obtained from the Quarterly
Census of Employment and Wages (QCEW) program, which
is administered by the Bureau of Labor Statistics (BLS).
Industry. Employers are classified according to the 2007
version of the North American Industry Classification System
(NAICS). For temporary help and professional employer
organization industries, monthly MLS-related statistics
generally reflect layoffs related to underlying client
companies in other industries. An individual layoff action at a
client company can be small, but when initial claimants
associated with many such layoffs are assigned to a
temporary help or professional employer organization firm, a
mass layoff event may trigger.
Initial claimant. A person who files any notice of unemployment to initiate a request either for a determination of
entitlement to and eligibility for compensation, or for a
subsequent period of unemployment within a benefit year or
period of eligibility.
Mass layoff event. Fifty or more initial claims for
unemployment insurance benefits filed against an employer
during a 5-week period, regardless of duration.
Seasonal adjustment
Effective with the release of data for January 2005, BLS
began publishing six seasonally adjusted monthly MLS
series. The six series are the numbers of mass layoff events
and mass layoff initial claims for the total, private nonfarm,
and manufacturing sectors.
Seasonal adjustment is the process of estimating and
removing the effect on time series data of regularly recurring
seasonal events such as changes in the weather, holidays, and
the beginning and ending of the school year. The use of
seasonal adjustment makes it easier to observe fundamental
changes in time series, particularly those associated with
general economic expansions and contractions.
The MLS data are seasonally adjusted using the X-12ARIMA seasonal adjustment method on a concurrent basis.
Concurrent seasonal adjustment uses all available monthly
estimates, including those for the current month, in
developing seasonal adjustment factors. Revisions to the most
recent 5 years of seasonally adjusted data will be made once a
year with the issuance of December data. Before the data are
seasonally adjusted, prior adjustments are made to the
original data to adjust them for differences in the number of
weeks used to calculate the monthly data. Because weekly
unemployment insurance claims are aggregated to form
monthly data, a particular month's value could be calculated
with 5 weeks of data in 1 year and 4 weeks in another. The
effects of these differences could seriously distort the
seasonal factors if they were ignored in the seasonal
adjustment process. These effects are modeled in the X-12ARIMA program and are permanently removed from the
final seasonally adjusted series.
Table 1. Mass layoff events and initial claimants for unemployment insurance, May 2008 to April 2012,
seasonally adjusted
Total
Date
Private nonfarm
Manufacturing
Initial
claimants
Events
Initial
claimants
Events
Initial
claimants
2008
May ..............................................................
June .............................................................
July ...............................................................
August ..........................................................
September ...................................................
October ........................................................
November ....................................................
December ....................................................
1,567
1,612
1,589
1,763
2,159
2,201
2,406
2,437
160,475
163,425
163,572
181,853
229,180
226,853
239,239
244,889
1,432
1,471
1,452
1,632
1,990
2,043
2,247
2,261
150,893
152,133
153,060
172,147
215,749
213,454
225,404
230,621
470
491
465
578
629
698
907
935
62,776
68,862
62,210
77,464
82,011
93,252
103,836
116,181
2009
January ........................................................
February .......................................................
March ...........................................................
April ..............................................................
May ..............................................................
June .............................................................
July ...............................................................
August ..........................................................
September ...................................................
October ........................................................
November ....................................................
December ....................................................
2,254
3,059
2,999
2,566
2,710
2,466
2,186
2,340
2,261
1,969
1,757
1,719
235,371
326,392
299,322
249,129
284,468
247,597
222,941
216,047
214,018
195,752
164,454
155,056
2,083
2,901
2,800
2,349
2,516
2,257
1,979
2,115
2,048
1,772
1,588
1,543
221,653
310,378
282,414
232,632
267,869
230,502
203,911
197,172
198,761
178,172
151,172
140,835
726
1,251
1,230
1,007
1,181
1,048
636
751
786
571
472
424
92,293
145,839
154,168
116,051
147,184
137,649
75,728
77,894
91,125
65,217
52,855
44,096
2010
January ........................................................
February .......................................................
March ...........................................................
April ..............................................................
May ..............................................................
June .............................................................
July ...............................................................
August ..........................................................
September ...................................................
October ........................................................
November ....................................................
December ....................................................
1,707
1,631
1,676
1,637
1,608
1,695
1,519
1,588
1,510
1,654
1,592
1,477
168,044
156,292
149,816
154,558
150,996
151,435
138,091
159,329
133,576
149,589
161,145
135,849
1,529
1,465
1,469
1,452
1,357
1,475
1,316
1,399
1,295
1,446
1,410
1,271
154,187
141,831
134,518
138,503
130,273
132,742
122,162
136,697
115,349
132,146
145,494
121,171
471
374
356
368
302
325
304
390
328
354
360
322
53,817
43,620
40,705
44,506
29,932
33,298
32,253
43,154
34,333
38,937
39,977
36,267
2011
January ........................................................
February .......................................................
March ...........................................................
April ..............................................................
May ..............................................................
June .............................................................
July ...............................................................
August ..........................................................
September ...................................................
October ........................................................
November ....................................................
December ....................................................
1,536
1,434
1,275
1,548
1,600
1,513
1,562
1,551
1,447
1,335
1,332
1,384
148,952
131,569
115,391
145,836
144,412
143,384
145,078
164,275
147,353
118,924
131,627
145,648
1,348
1,242
1,118
1,383
1,404
1,334
1,348
1,347
1,306
1,205
1,192
1,238
131,869
116,745
102,722
131,317
127,793
128,410
125,285
149,874
134,038
107,330
120,760
130,583
337
297
251
341
374
344
346
382
364
341
324
351
37,477
26,696
28,988
37,053
39,180
36,265
36,312
49,194
38,026
33,926
36,563
39,081
2012
January ........................................................
February .......................................................
March ...........................................................
April ..............................................................
1,434
1,293
1,273
1,388
129,920
119,463
121,310
135,600
1,298
1,153
1,125
1,222
119,102
108,577
109,421
120,213
341
282
261
287
33,597
27,388
26,348
33,243
Events
Table 2. Mass layoff events and initial claimants for unemployment insurance, May 2008 to April 2012,
not seasonally adjusted
Total
Date
Private nonfarm
Manufacturing
Events
Initial
claimants
Events
Initial
claimants
Events
Initial
claimants
2008
May ..............................................................
June .............................................................
July ...............................................................
August ..........................................................
September ...................................................
October ........................................................
November ....................................................
December ....................................................
1,552
1,622
1,891
1,427
1,292
2,125
2,574
3,377
159,471
166,742
200,382
139,999
129,586
221,784
241,589
351,305
1,438
1,315
1,687
1,343
1,202
1,917
2,389
3,232
150,462
140,916
186,018
133,146
122,505
205,553
226,657
340,220
388
309
760
414
361
689
997
1,378
51,698
42,097
108,733
51,912
46,391
100,457
107,620
172,529
2009
January ........................................................
February .......................................................
March ...........................................................
April ..............................................................
May ..............................................................
June .............................................................
July ...............................................................
August ..........................................................
September ...................................................
October ........................................................
November ....................................................
December ....................................................
3,806
2,262
2,191
2,547
2,738
2,519
3,054
1,428
1,371
1,934
1,870
2,310
388,813
218,438
228,387
256,930
289,628
256,357
336,654
125,024
123,177
193,904
164,496
214,648
3,633
2,173
2,107
2,385
2,572
2,051
2,659
1,334
1,258
1,678
1,679
2,166
375,293
210,755
221,397
243,321
274,047
216,063
296,589
117,193
115,141
172,883
150,751
203,655
1,461
945
940
887
1,005
674
1,133
436
448
566
517
615
172,757
103,588
114,747
100,872
123,683
85,726
154,208
41,151
51,126
69,655
55,053
64,540
2010
January ........................................................
February .......................................................
March ...........................................................
April ..............................................................
May ..............................................................
June .............................................................
July ...............................................................
August ..........................................................
September ...................................................
October ........................................................
November ....................................................
December ....................................................
2,860
1,183
1,197
1,840
1,354
1,861
2,124
976
920
1,642
1,676
1,931
278,679
102,818
111,727
199,690
123,333
171,190
206,254
92,435
77,654
148,638
158,048
184,130
2,682
1,091
1,111
1,697
1,170
1,355
1,732
897
806
1,373
1,477
1,763
265,074
96,022
105,514
184,654
109,203
125,872
172,248
83,021
67,987
127,865
142,591
172,881
962
282
273
424
216
212
532
230
187
351
389
465
104,846
30,728
29,745
55,178
19,334
21,083
64,200
23,088
19,403
40,861
41,383
52,816
2011
January ........................................................
February .......................................................
March ...........................................................
April ..............................................................
May ..............................................................
June .............................................................
July ...............................................................
August ..........................................................
September ...................................................
October ........................................................
November ....................................................
December ....................................................
2,558
1,024
908
1,750
1,367
1,661
2,176
961
1,189
1,101
1,393
2,433
246,463
85,585
85,095
189,919
119,911
159,930
216,774
99,213
117,232
96,914
127,750
263,665
2,372
919
844
1,625
1,221
1,238
1,759
875
1,095
950
1,245
2,258
229,765
78,718
80,014
176,478
108,531
122,821
174,078
93,159
107,300
83,748
117,474
247,916
693
222
191
397
270
226
602
228
296
265
349
658
75,006
18,471
20,869
47,104
25,199
22,986
71,814
26,916
32,058
28,447
37,799
75,033
2012
January ........................................................
February .......................................................
March ...........................................................
April ..............................................................
1,705
895
1,125
1,421
141,703
73,974
117,817
146,358
1,587
820
1,040
1,293
132,754
69,076
110,954
132,697
415
196
242
256
38,021
16,555
24,241
32,518
Table 3. Industry distribution: Mass layoff events and initial claimants for unemployment insurance, not seasonally adjusted
1
Mass layoff totals
Events
Industry
Average weekly mass layoffs
Events
Initial claimants
Initial claimants
April
April
April
April
April
April
April
April
2011
2012
2011
2012
2011
2012
2011
2012
1,750
1,685
60
1,421
1,378
85
189,919
183,436
6,958
146,358
140,376
7,679
350
337
12
355
345
21
37,984
36,687
1,392
36,590
35,094
1,920
Total, private nonfarm ..................................................
Mining .........................................................................
Utilities ........................................................................
Construction ...............................................................
Construction of buildings ........................................
Heavy and civil engineering construction ...............
Specialty trade contractors .....................................
Manufacturing ............................................................
Food .......................................................................
Beverage and tobacco products ............................
Textile mills ............................................................
Textile product mills ...............................................
Apparel ...................................................................
Leather and allied products ....................................
Wood products .......................................................
Paper ......................................................................
Printing and related support activities ....................
Petroleum and coal products .................................
Chemicals ..............................................................
Plastics and rubber products ..................................
Nonmetallic mineral products .................................
Primary metals .......................................................
Fabricated metal products ......................................
Machinery ...............................................................
Computer and electronic products .........................
Electrical equipment and appliances ......................
Transportation equipment ......................................
Furniture and related products ...............................
Miscellaneous manufacturing .................................
1,625
4
1,293
7
176,478
270
132,697
774
325
1
323
2
35,296
54
33,174
194
(3)
161
25
52
84
397
84
6
5
6
10
19
6
8
5
21
9
12
21
16
18
16
117
9
9
(3)
138
28
45
65
256
86
5
24
3
12
(3)
12,121
1,917
4,469
5,735
47,104
9,064
438
792
536
964
1,681
590
858
453
2,113
926
944
1,758
2,552
1,675
1,736
18,328
831
865
(3)
9,720
1,845
3,066
4,809
32,518
8,735
293
3,246
260
1,329
(3)
32
5
10
17
79
17
1
1
1
2
4
1
2
1
4
2
2
4
3
4
3
23
2
2
(3)
35
7
11
16
64
22
1
6
1
3
(3)
2,424
383
894
1,147
9,421
1,813
88
158
107
193
336
118
172
91
423
185
189
352
510
335
347
3,666
166
173
(3)
2,430
461
767
1,202
8,130
2,184
73
812
65
332
Wholesale trade .........................................................
4
Retail trade ..............................................................
Building material and garden supply stores ...........
Food and beverage stores .....................................
Clothing and clothing accessories stores ...............
General merchandise stores ..................................
4
Transportation and warehousing .............................
Truck transportation ...............................................
Transit and ground passenger transportation ........
Support activities for transportation ........................
Information .................................................................
Finance and insurance ...............................................
Real estate and rental and leasing .............................
Professional and technical services ...........................
Management of companies and enterprises ..............
Administrative and waste services .............................
Educational services ..................................................
Health care and social assistance ..............................
Arts, entertainment, and recreation ............................
Accommodation and food services ............................
Accommodation .....................................................
Food services and drinking places .........................
Other services, except public administration ..............
Unclassified ...............................................................
27
147
7
33
9
57
194
11
165
2
Total .......................................................................
Total, private ..................................................................
Agriculture, forestry, fishing and hunting ....................
Government ...................................................................
Federal .......................................................................
State ...........................................................................
State government education .................................
Local ...........................................................................
Local government education .................................
1
(3)
42
42
15
80
7
262
17
46
45
127
49
78
9
(3)
65
6
18
6
41
14
(3)
10
3
7
3
9
7
8
7
17
14
5
26
6
(3)
29
105
9
14
9
45
171
4
151
(3)
35
33
8
55
(3)
220
18
41
40
110
39
71
9
10
43
5
13
5
25
7
2,005
16,501
597
3,273
531
8,317
26,537
697
24,454
(3)
5,689
3,482
1,389
8,572
550
23,380
2,522
3,397
4,650
17,269
4,302
12,967
845
(3)
6,483
582
1,714
464
4,187
1,455
(3)
780
335
436
343
2,645
546
839
788
1,649
1,366
722
7,093
634
(3)
2,498
9,491
640
1,259
625
5,018
23,008
243
21,409
(3)
4,024
2,095
601
6,288
(3)
17,166
2,778
3,133
3,344
13,707
3,332
10,375
521
452
5,982
395
3,164
406
2,423
1,032
5
29
1
7
2
11
39
2
33
(3)
8
8
3
16
1
52
3
9
9
25
10
16
2
(3)
13
1
4
1
8
3
(3)
3
1
2
1
2
2
2
2
4
4
1
7
2
(3)
7
26
2
4
2
11
43
1
38
(3)
9
8
2
14
(3)
55
5
10
10
28
10
18
2
3
11
1
3
1
6
2
401
3,300
119
655
106
1,663
5,307
139
4,891
(3)
1,138
696
278
1,714
110
4,676
504
679
930
3,454
860
2,593
169
(3)
1,297
116
343
93
837
291
(3)
195
84
109
86
661
137
210
197
412
342
181
1,773
159
(3)
625
2,373
160
315
156
1,255
5,752
61
5,352
(3)
1,006
524
150
1,572
(3)
4,292
695
783
836
3,427
833
2,594
130
113
1,496
99
791
102
606
258
2
Data were reported by all states and the District of Columbia.
lengths of months. There were 5 weeks in April 2011
3
Data do not meet BLS or state agency disclosure standards.
and 4 weeks in April 2012. Average weekly events
4
Includes other industries not shown.
and initial claimants may not sum to subtotals and totals
NOTE: Dash represents zero.
Average weekly analysis mitigates the effect of differing
due to rounding.
Table 4. Region and state distribution: Mass layoff events and initial claimants for unemployment insurance,
not seasonally adjusted
Mass layoff totals
Events
Census region and state
April
2011
Average weekly mass layoffs¹
Initial Claimants
April
2012
April
2011
April
2012
Events
April
2011
Initial Claimants
April
2012
April
2011
April
2012
Total ² ................................................
1,750
1,421
189,919
146,358
350
355
37,984
36,590
Northeast .............................................
Connecticut ......................................
Maine ...............................................
Massachusetts .................................
New Hampshire ...............................
New Jersey ......................................
New York .........................................
Pennsylvania ...................................
Rhode Island ....................................
Vermont ...........................................
402
10
7
17
7
70
153
112
9
17
363
6
7
17
6
65
152
91
9
10
54,129
1,056
818
2,040
1,107
11,776
22,636
10,791
2,105
1,800
48,882
530
696
3,291
928
10,222
22,367
7,943
2,081
824
80
2
1
3
1
14
31
22
2
3
91
2
2
4
2
16
38
23
2
3
10,826
211
164
408
221
2,355
4,527
2,158
421
360
12,221
133
174
823
232
2,556
5,592
1,986
520
206
South ...................................................
Alabama ...........................................
Arkansas ..........................................
Delaware ..........................................
District of Columbia ..........................
Florida ..............................................
Georgia ............................................
Kentucky ..........................................
Louisiana .........................................
Maryland ..........................................
Mississippi .......................................
North Carolina ..................................
Oklahoma ........................................
South Carolina .................................
Tennessee .......................................
Texas ...............................................
Virginia .............................................
West Virginia ....................................
431
28
318
17
6
7
70
24
25
13
3
13
51
4
12
9
45
14
5
42,685
3,080
30,733
2,706
851
542
4,913
2,879
2,946
1,067
256
835
4,782
621
1,321
752
4,621
1,141
500
86
6
80
4
2
2
18
6
6
3
1
3
13
1
3
2
11
4
1
8,537
616
7,683
677
213
136
1,228
720
737
267
64
209
1,196
155
330
188
1,155
285
125
Midwest ................................................
Illinois ...............................................
Indiana .............................................
Iowa .................................................
Kansas .............................................
Michigan ..........................................
Minnesota ........................................
Missouri ...........................................
Nebraska .........................................
North Dakota ....................................
Ohio .................................................
South Dakota ...................................
Wisconsin ........................................
West .....................................................
Alaska ..............................................
Arizona .............................................
California ..........................................
Colorado ..........................................
Hawaii ..............................................
Idaho ................................................
Montana ...........................................
Nevada ............................................
New Mexico .....................................
Oregon .............................................
Utah .................................................
Washington ......................................
Wyoming ..........................................
Puerto Rico ......................................
(3)
8
(3)
98
40
56
22
5
27
14
6
19
14
67
23
(3)
383
56
41
17
5
50
16
23
9
(3)
76
216
38
17
13
9
23
8
27
3
34
44
534
9
40
348
15
524
9
30
391
12
(3)
87
(3)
551
(3)
7,600
3,380
9,722
1,669
365
1,987
1,240
392
1,913
1,259
7,118
2,063
(3)
44,126
6,701
4,689
2,143
381
6,813
1,023
2,259
768
(3)
7,965
26,205
5,969
4,867
1,388
726
2,313
455
1,770
289
3,651
4,777
48,979
1,137
5,635
29,264
1,750
40,538
1,008
4,627
26,375
1,401
(3)
11,082
(3)
(3)
20
8
11
4
1
5
3
1
4
3
13
5
(3)
77
11
8
3
1
10
3
5
2
(3)
15
54
10
4
3
2
6
2
7
1
9
11
107
2
8
70
3
131
2
8
98
3
(3)
17
(3)
10
7
23
9
25
13
28
(3)
7
6
13
4
17
5
26
(3)
896
438
1,703
711
2,886
1,232
2,725
(3)
771
526
1,051
327
1,276
482
2,301
(3)
(3)
17
(3)
12
(3)
1,676
(3)
1,169
(3)
1
See footnote 1, table 3.
3
2
See footnote 2, table 3.
NOTE: Dash represents zero.
2
2
1
5
2
5
3
6
(3)
(3)
1,520
676
1,944
334
73
397
248
78
383
252
1,424
413
(3)
8,825
1,340
938
429
76
1,363
205
452
154
(3)
1,593
6,551
1,492
1,217
347
182
578
114
443
72
913
1,194
9,796
227
1,127
5,853
350
10,135
252
1,157
6,594
350
2
2
3
1
4
1
7
(3)
179
88
341
142
577
246
545
(3)
193
132
263
82
319
121
575
3
(3)
335
(3)
292
(3)
3
(3)
110
(3)
2,216
Data do not meet BLS or state agency disclosure standards.
© Copyright 2026 Paperzz