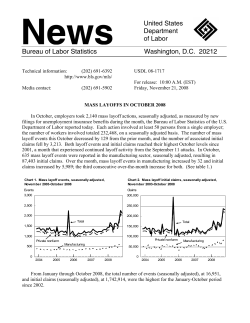
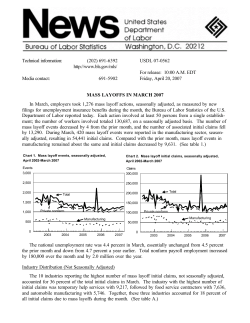
USDL-11-1545 For release 10:00 a.m. (EDT) Tuesday, October 25, 2011 Technical information: (202) 691-6392 • [email protected] • www.bls.gov/mls Media contact: (202) 691-5902 • [email protected] MASS LAYOFFS — SEPTEMBER 2011 Employers took 1,495 mass layoff actions in September involving 153,229 workers, seasonally adjusted, as measured by new filings for unemployment insurance benefits during the month, the U.S. Bureau of Labor Statistics reported today. Each mass layoff involved at least 50 workers from a single employer. The number of mass layoff events in September decreased by 92 from August, and the number of associated initial claims decreased by 12,318. In September, 376 mass layoff events were reported in the manufacturing sector, seasonally adjusted, resulting in 39,929 initial claims. (See table 1.) Chart 1. Mass layoff events, seasonally adjusted, October 2006-September 2011 Events 3,500 Chart 2. Mass layoff initial claims, seasonally adjusted, October 2006-September 2011 Claims 350,000 3,000 300,000 2,500 2,000 250,000 Total 200,000 150,000 1,500 1,000 500 0 Total Private nonfarm Manufacturing 100,000 50,000 Private nonfarm Manufacturing 0 The national unemployment rate was 9.1 percent in September, unchanged from the prior month but down from 9.6 percent a year earlier. In September, total nonfarm payroll employment increased by 103,000 over the month and by 1,490,000 over the year. Industry Distribution (Not Seasonally Adjusted) The number of mass layoff events in September was 1,189, not seasonally adjusted, resulting in 117,232 initial claims for unemployment insurance. (See table 2.) Over the year, the number of average weekly mass layoff events increased by 8, and associated average weekly initial claims increased by 4,032. Ten of the 19 major industry sectors in the private sector reported over-the-year increases in average weekly initial claims, with the largest increase occurring in manufacturing. (Average weekly analysis mitigates the effect of differing lengths of months. See the Technical Note.) The six-digit industry with the largest number of initial claims in September was temporary help services. (See table A. The table includes both publicly and privately owned entities.) Table A. Industries with the largest number of mass layoff initial claims in September 2011, not seasonally adjusted September peak Industry Initial claims Year Initial claims 1 Temporary help services .................................. Elementary and secondary schools ..................... Motion picture and video production .................. Payroll services .................................................. Discount department stores ................................ 10,040 3,650 3,034 3,027 2,973 2001 2005 1997 1999 2005 12,752 15,815 11,176 4,737 3,550 2,246 1,992 1,872 2008 2011 2005 2011 2000 4,520 1,992 4,873 1 Professional employer organizations ................. Highway, street, and bridge construction ............ Supermarkets and other grocery stores .............. Teleproduction and postproduction services ....... Light truck and utility vehicle manufacturing ......... 1 2 (2) (2) (2) 3,688 See the Technical Note for more information on these industries. Data do not meet BLS or state agency disclosure standards. The manufacturing sector accounted for 25 percent of all mass layoff events and 27 percent of initial claims filed in September. A year earlier, manufacturing made up 20 percent of events and 25 percent of initial claims. Within this sector, the numbers of mass layoff claimants in September 2011 was greatest in the food and transportation equipment subsectors. (See table 3.) Fifteen of the 21 manufacturing subsectors experienced over-the-year increases in average weekly initial claims, with the largest increases occurring in food and textile mills. Geographic Distribution (Not Seasonally Adjusted) All 4 regions and 6 of the 9 divisions experienced over-the-year increases in average weekly initial claims for unemployment insurance due to mass layoffs in September. Among the census regions, the Northeast had the largest over-the-year increase in average weekly initial claims. Of the geographic divisions, the Pacific and Middle Atlantic registered the largest over-the-year increases in average weekly initial claims. California recorded the highest number of mass layoff initial claims in September, followed by Pennsylvania, New York, North Carolina, and Illinois. Twenty-eight states and the District of Columbia experienced over-the-year increases in average weekly initial claims, led by California and Pennsylvania. (See table 6.) Note The monthly data series in this release cover mass layoffs of 50 or more workers beginning in a given month, regardless of the duration of the layoffs. For private nonfarm establishments, information on the length of the layoff is obtained later and issued in a quarterly release that reports on mass layoffs lasting more than 30 days (referred to as “extended mass layoffs”). The quarterly release provides more information on the industry classification and location of the establishment and on the demographics of -2- the laid-off workers. Because monthly figures include short-term layoffs of 30 days or less, the sum of the figures for the 3 months in a quarter will be higher than the quarterly figure for mass layoffs of more than 30 days. (See table 4.) See the Technical Note for more detailed definitions. ____________ The Extended Mass Layoffs news release for the Third Quarter 2011 is scheduled to be released on Wednesday, November 9, 2011, at 10:00 a.m. (EST). The Mass Layoffs news release for October is scheduled to be released on Tuesday, November 22, 2011, at 10:00 a.m. (EST). Upcoming Changes to the Mass Layoffs News Release The following changes will be introduced in the October 2011 mass layoffs news release scheduled to be issued on Tuesday, November 22, 2011. Charts 1 and 2 will be replaced with a single chart showing 10 years of mass layoff initial claims data. Table A will only show private nonfarm industries. Seasonally adjusted data will be removed from Table 3 since these data are shown in Table 1. Select three-digit industry detail will be added to several two-digit industries. Public education industry detail will be displayed within the state and local government sections of Table 3. The previous two months’ data will be removed; the current month and the previous year’s data will be shown. Table 4 will be removed from the monthly release and issued as a supplemental table to the quarterly release. Table 5 and Table 6 will be combined to create a new Table 4. The geographic divisions shown in Table 5 will be removed, and the states will be grouped into their respective Census regions. The previous two months’ data will be removed; the current month and previous year’s data will be shown. The new Tables 3 and 4 will include average weekly mass layoff events and average weekly initial claims for the current month and previous year. See the Technical Note for a description of average weekly analysis. -3- Technical Note The Mass Layoff Statistics (MLS) program is a federalstate program that uses a standardized automated approach to identifying, describing, and tracking the effects of major job cutbacks, using data from each state's unemployment insurance database. Each month, states report on employers which have at least 50 initial claims filed against them during a consecutive 5-week period. These employers then are contacted by the state agency to determine whether these separations lasted 31 days or longer, and, if so, other information concerning the layoff is collected. States report on layoffs lasting more than 1 month on a quarterly basis. A given month contains an aggregation of the weekly unemployment insurance claims filings for the Sunday through Saturday weeks in that month. All weeks are included for the particular month, except if the first day of the month falls on Saturday. In this case, the week is included in the prior month's tabulations. This means that some months will contain 4 weeks and others, 5 weeks. The number of weeks in a given month may be different from year to year, and the number of weeks in a year may vary. Therefore, analysis of over-the-month and over-the-year change in not seasonally adjusted series should take this calendar effect into consideration. The MLS program resumed operations in April 1995 after it had been terminated in November 1992 due to lack of funding. Prior to April 1995, monthly layoff statistics were not available. Information in this release will be made available to sensory impaired individuals upon request. Voice phone: (202) 691-5200; Federal Relay Service: (800) 877-8339 Definitions Employer. Employers in the MLS program include those covered by state unemployment insurance laws. Information on employers is obtained from the Quarterly Census of Employment and Wages (QCEW) program, which is administered by the Bureau of Labor Statistics (BLS). Industry. Employers are classified according to the 2007 version of the North American Industry Classification System (NAICS). For temporary help and professional employer organization industries, monthly MLS-related statistics generally reflect layoffs related to underlying client companies in other industries. An individual layoff action at a client company can be small, but when initial claimants associated with many such layoffs are assigned to a temporary help or professional employer organization firm, a mass layoff event may trigger. Initial claimant. A person who files any notice of unemployment to initiate a request either for a determination of entitlement to and eligibility for compensation, or for a subsequent period of unemployment within a benefit year or period of eligibility. Mass layoff event. Fifty or more initial claims for unemployment insurance benefits filed against an employer during a 5-week period, regardless of duration. Seasonal adjustment Effective with the release of data for January 2005, BLS began publishing six seasonally adjusted monthly MLS series. The six series are the numbers of mass layoff events and mass layoff initial claims for the total, private nonfarm, and manufacturing sectors. Seasonal adjustment is the process of estimating and removing the effect on time series data of regularly recurring seasonal events such as changes in the weather, holidays, and the beginning and ending of the school year. The use of seasonal adjustment makes it easier to observe fundamental changes in time series, particularly those associated with general economic expansions and contractions. The MLS data are seasonally adjusted using the X-12ARIMA seasonal adjustment method on a concurrent basis. Concurrent seasonal adjustment uses all available monthly estimates, including those for the current month, in developing seasonal adjustment factors. Revisions to the most recent 5 years of seasonally adjusted data will be made once a year with the issuance of December data. Before the data are seasonally adjusted, prior adjustments are made to the original data to adjust them for differences in the number of weeks used to calculate the monthly data. Because weekly unemployment insurance claims are aggregated to form monthly data, a particular month's value could be calculated with 5 weeks of data in 1 year and 4 weeks in another. The effects of these differences could seriously distort the seasonal factors if they were ignored in the seasonal adjustment process. These effects are modeled in the X-12ARIMA program and are permanently removed from the final seasonally adjusted series. Table 1. Mass layoff events and initial claimants for unemployment insurance, October 2007 to September 2011, seasonally adjusted Total Date Private nonfarm Manufacturing Initial claimants Events Initial claimants Events Initial claimants 2007 October ........................................................ November .................................................... December .................................................... 1,330 1,397 1,553 133,063 145,339 154,275 1,210 1,269 1,435 124,455 135,651 144,785 439 408 463 56,970 56,985 59,445 2008 January ........................................................ February ....................................................... March ........................................................... April .............................................................. May .............................................................. June ............................................................. July ............................................................... August .......................................................... September ................................................... October ........................................................ November .................................................... December .................................................... 1,437 1,604 1,500 1,292 1,582 1,631 1,581 1,791 2,192 2,221 2,415 2,443 146,900 175,128 150,502 128,901 161,944 164,508 164,497 181,107 233,034 229,254 228,107 245,661 1,302 1,441 1,388 1,162 1,444 1,488 1,443 1,653 2,024 2,062 2,256 2,264 135,622 163,475 140,424 118,016 152,230 153,014 153,720 171,705 219,532 215,787 214,631 231,138 431 471 435 449 468 491 463 583 635 697 900 927 55,562 59,118 56,156 58,402 62,452 68,198 62,425 77,874 82,471 92,408 102,284 114,280 2009 January ........................................................ February ....................................................... March ........................................................... April .............................................................. May .............................................................. June ............................................................. July ............................................................... August .......................................................... September ................................................... October ........................................................ November .................................................... December .................................................... 2,272 2,801 2,950 2,579 2,758 2,506 2,192 2,419 2,305 1,975 1,754 1,725 238,717 315,507 295,543 251,032 288,319 250,275 223,697 220,262 219,924 195,347 154,223 156,274 2,103 2,636 2,758 2,368 2,557 2,293 1,977 2,177 2,095 1,780 1,585 1,545 224,850 300,042 279,027 234,796 271,425 232,814 203,365 201,951 204,596 177,977 141,439 141,649 756 1,194 1,205 997 1,187 1,048 620 778 799 570 464 420 100,927 138,583 144,713 121,435 147,548 135,389 72,932 83,837 91,665 63,646 51,891 43,584 2010 January ........................................................ February ....................................................... March ........................................................... April .............................................................. May .............................................................. June ............................................................. July ............................................................... August .......................................................... September ................................................... October ........................................................ November .................................................... December .................................................... 1,716 1,492 1,635 1,675 1,665 1,729 1,528 1,658 1,541 1,649 1,579 1,483 171,633 149,369 146,901 159,358 155,352 153,937 138,581 163,325 137,941 147,204 148,800 137,992 1,541 1,318 1,436 1,498 1,405 1,504 1,316 1,453 1,331 1,445 1,397 1,272 157,597 135,490 131,953 143,814 133,913 134,837 121,378 141,489 119,654 130,264 133,845 122,688 494 351 347 371 314 326 296 409 336 353 350 319 60,059 40,564 37,273 48,646 30,967 32,646 30,752 47,668 34,641 37,394 39,072 35,977 2011 January ........................................................ February ....................................................... March ........................................................... April .............................................................. May .............................................................. June ............................................................. July ............................................................... August .......................................................... September ................................................... 1,534 1,421 1,286 1,564 1,599 1,532 1,579 1,587 1,495 149,799 130,818 118,523 143,927 143,540 143,444 145,000 165,547 153,229 1,344 1,220 1,128 1,401 1,405 1,348 1,363 1,373 1,347 132,730 116,190 105,636 129,702 127,494 128,105 124,745 150,136 139,151 341 291 253 327 373 341 342 391 376 39,189 26,060 27,619 35,022 38,673 35,693 35,460 48,997 39,929 Events Table 2. Mass layoff events and initial claimants for unemployment insurance, October 2007 to September 2011, not seasonally adjusted Total Date Private nonfarm Manufacturing Initial claimants Events Initial claimants Events Initial claimants 2007 October ........................................................ November .................................................... December .................................................... 1,083 1,799 2,167 108,455 198,220 224,214 929 1,593 2,071 97,716 181,184 216,898 338 514 699 50,918 75,413 91,754 2008 January ........................................................ February ....................................................... March ........................................................... April .............................................................. May .............................................................. June ............................................................. July ............................................................... August .......................................................... September ................................................... October ........................................................ November .................................................... December .................................................... 1,647 1,269 1,089 1,272 1,552 1,622 1,891 1,427 1,292 2,125 2,574 3,377 154,503 119,508 114,541 130,810 159,471 166,742 200,382 139,999 129,586 221,784 241,589 351,305 1,520 1,178 1,039 1,172 1,438 1,315 1,687 1,343 1,202 1,917 2,389 3,232 144,191 113,587 110,147 121,625 150,462 140,916 186,018 133,146 122,505 205,553 226,657 340,220 488 361 333 394 388 309 760 414 361 689 997 1,378 54,418 42,527 43,740 48,188 51,698 42,097 108,733 51,912 46,391 100,457 107,620 172,529 2009 January ........................................................ February ....................................................... March ........................................................... April .............................................................. May .............................................................. June ............................................................. July ............................................................... August .......................................................... September ................................................... October ........................................................ November .................................................... December .................................................... 3,806 2,262 2,191 2,547 2,738 2,519 3,054 1,428 1,371 1,934 1,870 2,310 388,813 218,438 228,387 256,930 289,628 256,357 336,654 125,024 123,177 193,904 164,496 214,648 3,633 2,173 2,107 2,385 2,572 2,051 2,659 1,334 1,258 1,678 1,679 2,166 375,293 210,755 221,397 243,321 274,047 216,063 296,589 117,193 115,141 172,883 150,751 203,655 1,461 945 940 887 1,005 674 1,133 436 448 566 517 615 172,757 103,588 114,747 100,872 123,683 85,726 154,208 41,151 51,126 69,655 55,053 64,540 2010 January ........................................................ February ....................................................... March ........................................................... April .............................................................. May .............................................................. June ............................................................. July ............................................................... August .......................................................... September ................................................... October ........................................................ November .................................................... December .................................................... 2,860 1,183 1,197 1,840 1,354 1,861 2,124 976 920 1,642 1,676 1,931 278,679 102,818 111,727 199,690 123,333 171,190 206,254 92,435 77,654 148,638 158,048 184,130 2,682 1,091 1,111 1,697 1,170 1,355 1,732 897 806 1,373 1,477 1,763 265,074 96,022 105,514 184,654 109,203 125,872 172,248 83,021 67,987 127,865 142,591 172,881 962 282 273 424 216 212 532 230 187 351 389 465 104,846 30,728 29,745 55,178 19,334 21,083 64,200 23,088 19,403 40,861 41,383 52,816 2011 January ........................................................ February ....................................................... March ........................................................... April .............................................................. May .............................................................. June ............................................................. July ............................................................... August .......................................................... September ................................................... 2,558 1,024 908 1,750 1,367 1,661 2,176 961 1,189 246,463 85,585 85,095 189,919 119,911 159,930 216,774 99,213 117,232 2,372 919 844 1,625 1,221 1,238 1,759 875 1,095 229,765 78,718 80,014 176,478 108,531 122,821 174,078 93,159 107,300 693 222 191 397 270 226 602 228 296 75,006 18,471 20,869 47,104 25,199 22,986 71,814 26,916 32,058 Events Table 3. Industry distribution: Mass layoff events and initial claimants for unemployment insurance Initial claimants for unemployment insurance Mass layoff events Industry September 2010 July 2011 August 2011 September September 2011 2010 July 2011 August 2011 1,541 1,331 336 1,579 1,363 342 1,587 1,373 391 1,495 1,347 376 Total ............................................................ 920 2,176 961 Total, private ........................................................ Agriculture, forestry, fishing and hunting ......... Total, private nonfarm ........................................ Mining .............................................................. Utilities ............................................................. Construction .................................................... Manufacturing .................................................. Food ............................................................ Beverage and tobacco products .................. Textile mills .................................................. Textile product mills ..................................... Apparel ........................................................ Leather and allied products ......................... Wood products ............................................ Paper ........................................................... Printing and related support activities .......... Petroleum and coal products ....................... 823 17 806 4 1,867 108 1,759 – 904 29 875 (2) 89 187 31 (2) 118 602 84 (2) 3 (2) 29 9 14 3 28 4 9 (2) – 65 228 51 6 8 3 10 – 11 7 6 – (2) 3 150 296 58 7 11 September 2011 137,941 119,654 34,641 145,000 124,745 35,460 165,547 150,136 48,997 153,229 139,151 39,929 1,189 77,654 216,774 99,213 117,232 1,108 13 1,095 68,913 926 67,987 447 182,960 8,882 174,078 – 94,711 1,552 93,159 108,119 819 107,300 (2) 6,137 19,403 3,216 (2) 8,990 71,814 9,998 (2) 277 (2) 3,341 1,107 1,526 869 2,826 298 930 (2) – 4,628 26,916 4,585 472 944 200 1,024 – 1,242 512 569 – (2) 159 10,813 32,058 6,532 656 1,784 Seasonally adjusted Total ............................................................... Total, private nonfarm ........................................ Manufacturing .................................................. Not seasonally adjusted 1 Chemicals .................................................... Plastics and rubber products ....................... Nonmetallic mineral products ...................... Primary metals ............................................. Fabricated metal products ........................... Machinery .................................................... Computer and electronic products ............... Electrical equipment and appliances ........... Transportation equipment ............................ Furniture and related products .................... Miscellaneous manufacturing ...................... (2) 3 – 22 4 3 3 (2) (2) 7 13 13 11 8 10 30 11 8 Wholesale trade ............................................... Retail trade ...................................................... Transportation and warehousing ..................... Information ....................................................... Finance and insurance .................................... Real estate and rental and leasing .................. Professional and technical services ................ Management of companies and enterprises ... Administrative and waste services .................. Educational services ........................................ Health care and social assistance ................... Arts, entertainment, and recreation ................. Accommodation and food services .................. Other services, except public administration ... Unclassified ..................................................... (2) 133 13 26 39 72 12 1 Government ......................................................... Federal ............................................................ State ................................................................ Local ................................................................ 97 19 22 56 1 2 16 99 31 24 29 4 23 Data were reported by all states and the District of Columbia. Data do not meet BLS or state agency disclosure standards. (2) 12 36 13 24 27 34 19 19 193 31 9 6 8 11 5 11 16 10 12 30 7 10 21 165 114 52 43 10 51 5 320 29 104 30 74 17 17 79 74 58 26 4 24 4 162 11 30 17 65 8 (2) 309 10 78 221 (2) 57 10 15 32 (2) 11 (2) 21 6 6 (2) 5 14 3 8 20 22 19 17 38 18 7 16 120 49 36 22 (2) 194 – 1,726 239 277 180 (2) (2) 609 1,381 1,006 1,787 562 1,793 4,166 792 573 1,011 9,764 2,268 2,365 2,602 267 1,504 (2) 39 3 186 12 39 27 82 12 – (2) 10,059 786 1,660 2,799 5,735 864 78 81 17 33 31 8,741 1,898 1,575 5,268 (2) 935 3,359 1,612 2,450 2,980 4,799 1,735 2,628 26,488 2,770 726 303 705 685 415 1,051 4,407 884 2,537 4,688 952 741 1,594 17,189 9,326 5,289 2,769 856 4,372 654 31,193 1,993 7,079 2,867 6,445 1,336 1,347 6,804 7,181 18,813 1,647 235 1,737 269 13,158 1,329 2,279 1,438 4,533 654 (2) 33,814 784 12,220 20,810 (2) 4,502 833 1,267 2,402 NOTE: Dash represents zero. (2) 993 (2) 1,662 544 451 (2) 376 1,011 363 869 2,010 3,069 1,235 1,872 6,006 1,342 912 1,316 12,805 4,611 6,431 1,821 (2) 6,476 182 17,285 791 2,711 2,092 6,357 1,067 – 9,113 1,685 2,857 4,571 Table 4. Mass layoff events and initial claimants for unemployment insurance, July 2009 to September 2011, not seasonally adjusted Private nonfarm Total mass layoffs Date Mass layoffs Events Initial claimants Events Initial claimants Extended mass layoffs lasting more than 30 days Realization rates 1 Events Initial claimants 2,034 406,823 38.7 76.9 2,416 468,577 43.7 88.9 1,870 368,664 38.3 79.0 2,008 396,441 47.6 94.5 1,370 260,030 39.9 80.4 1,999 390,445 43.3 88.1 1,490 257,031 36.0 66.2 Events Initial claimants 2009 July ............................................ August ........................................ September ................................. 3,054 1,428 1,371 336,654 125,024 123,177 2,659 1,334 1,258 296,589 117,193 115,141 Third Quarter ............................. 5,853 584,855 5,251 528,923 October ...................................... November .................................. December .................................. 1,934 1,870 2,310 193,904 164,496 214,648 1,678 1,679 2,166 172,883 150,751 203,655 Fourth Quarter ........................... 6,114 573,048 5,523 527,289 January ...................................... February .................................... March ......................................... 2,860 1,183 1,197 278,679 102,818 111,727 2,682 1,091 1,111 265,074 96,022 105,514 First Quarter ............................... 5,240 493,224 4,884 466,610 April ............................................ May ............................................ June ........................................... 1,840 1,354 1,861 199,690 123,333 171,190 1,697 1,170 1,355 184,654 109,203 125,872 Second Quarter ......................... 5,055 494,213 4,222 419,729 July ............................................ August ........................................ September ................................. 2,124 976 920 206,254 92,435 77,654 1,732 897 806 172,248 83,021 67,987 Third Quarter ............................. 4,020 376,343 3,435 323,256 October ...................................... November .................................. December .................................. 1,642 1,676 1,931 148,638 158,048 184,130 1,373 1,477 1,763 127,865 142,591 172,881 Fourth Quarter ........................... 5,249 490,816 4,613 443,337 January ...................................... February .................................... March ......................................... 2,558 1,024 908 246,463 85,585 85,095 2,372 919 844 229,765 78,718 80,014 First Quarter ............................... 4,490 417,143 4,135 388,497 April ............................................ May ............................................ June ........................................... 1,750 1,367 1,661 189,919 119,911 159,930 1,625 1,221 1,238 176,478 108,531 122,821 Second Quarter ......................... 4,778 469,760 4,084 407,830 July ............................................ August ........................................ September ................................. 2,176 961 1,189 216,774 99,213 117,232 1,759 875 1,095 174,078 93,159 107,300 Third Quarter ............................. 4,326 433,219 3,729 374,537 2010 2011 1 The event realization rate is the percentage of all private nonfarm 2,p 1,624 2,p 231,643 p 39.8 p 56.8 data on these layoffs become available. Experience suggests that the mass layoff events lasting more than 30 days. The initial claimant realization number of extended mass layoff events is generally revised upwards rate is the percentage of all private nonfarm mass layoff initial claimants by less than 10 percent and the number of initial claimants associated associated with layoffs lasting more than 30 days. 2 These quarterly numbers are provisional and will be revised as more with such events increases by 25-40 percent. p = preliminary. Table 5. Mass layoff events and initial claimants for unemployment insurance by census region and division, not seasonally adjusted Initial claimants for unemployment insurance Mass layoff events Census region and division September 2010 July 2011 August 2011 September 2011 September 2010 July 2011 August 2011 September 2011 United States 1 ......................................... 920 2,176 961 1,189 77,654 216,774 99,213 117,232 Northeast .......................................................... New England ................................................ Middle Atlantic .............................................. 160 15 145 363 44 319 187 23 164 286 23 263 14,411 1,357 13,054 34,691 3,808 30,883 29,937 7,784 22,153 26,131 2,245 23,886 South ................................................................ South Atlantic ............................................... East South Central ....................................... West South Central ...................................... 259 153 41 65 624 358 164 102 277 174 47 56 311 183 52 76 21,507 11,811 3,633 6,063 62,261 33,888 17,365 11,008 25,771 15,565 4,879 5,327 28,956 16,747 4,988 7,221 Midwest ............................................................ East North Central ........................................ West North Central ....................................... 155 115 40 505 359 146 181 132 49 219 178 41 14,964 11,280 3,684 62,114 41,262 20,852 20,541 14,839 5,702 21,885 18,293 3,592 West ................................................................. Mountain ....................................................... Pacific ........................................................... 346 47 299 684 67 617 316 36 280 373 43 330 26,772 4,461 22,311 57,708 6,339 51,369 22,964 3,048 19,916 40,260 3,678 36,582 1 See footnote 1, table 3. NOTE: The States (including the District of Columbia) that comprise the census divisions are: New England: Connecticut, Maine, Massachusetts, New Hampshire, Rhode Island, and Vermont; Middle Atlantic: New Jersey, New York, and Pennsylvania; South Atlantic: Delaware, District of Columbia, Florida, Georgia, Maryland, North Carolina, South Carolina, Virginia, and West Virginia; East South Central: Alabama, Kentucky, Mississippi, and Tennessee; West South Central: Arkansas, Louisiana, Oklahoma, and Texas; East North Central: Illinois, Indiana, Michigan, Ohio, and Wisconsin; West North Central: Iowa, Kansas, Minnesota, Missouri, Nebraska, North Dakota, and South Dakota; Mountain: Arizona, Colorado, Idaho, Montana, Nevada, New Mexico, Utah, and Wyoming; and Pacific: Alaska, California, Hawaii, Oregon, and Washington. Table 6. State distribution: Mass layoff events and initial claimants for unemployment insurance, not seasonally adjusted Initial claimants for unemployment insurance Mass layoff events State September 2010 Total 1 .............................................. 920 Alabama .............................................. Alaska ................................................. Arizona ................................................ Arkansas ............................................. California ............................................. Colorado ............................................. Connecticut ......................................... Delaware ............................................. District of Columbia ............................. Florida ................................................. Georgia ............................................... Hawaii ................................................. Idaho ................................................... 13 4 6 3 264 10 Illinois .................................................. Indiana ................................................ Iowa .................................................... Kansas ................................................ Kentucky ............................................. Louisiana ............................................ Maine .................................................. Maryland ............................................. Massachusetts .................................... Michigan ............................................. Minnesota ........................................... Mississippi .......................................... Missouri .............................................. Montana .............................................. Nebraska ............................................ Nevada ............................................... New Hampshire .................................. New Jersey ......................................... New Mexico ........................................ New York ............................................ 3 North Carolina .................................. North Dakota ....................................... Ohio .................................................... Oklahoma ........................................... Oregon ................................................ Pennsylvania ...................................... (2) (2) – 91 24 3 7 35 10 3 8 10 11 2 ( ) 6 7 11 5 12 19 4 5 13 (2) 22 3 52 13 – 22 (2) 17 71 2 Rhode Island ....................................... South Carolina .................................... South Dakota ...................................... Tennessee .......................................... Texas .................................................. Utah .................................................... Vermont .............................................. Virginia ................................................ Washington ......................................... West Virginia ....................................... Wisconsin ........................................... Wyoming ............................................. ( ) 7 Puerto Rico ......................................... 16 1 – July 2011 August 2011 2,176 961 1,189 60 14 4 5 10 251 6 3 14 6 9 9 297 7 4 (2) 147 45 (2) (2) 78 30 (2) (2) 69 28 (2) 9 (2) 4 (2) 5 48 31 19 12 54 21 9 13 16 130 68 25 36 35 13 9 9 13 7 5,053 846 362 1,245 1,454 688 ( ) 4 12 21 7 10 17 48 22 8 3 20 16 3 9 8 31 6 8 21 2 ( ) 4 11 3 3 13 332 550 1,238 (2) 40 (2) 1,665 238 5,499 1,372 2 ( ) 23 17 571 8 8 3 4 8 10 5 81 9 142 80 3 67 6 27 96 (2) 23 5 71 21 3 25 (2) 10 70 37 3 14 132 4 28 4 20 ( ) 20 – – (2) 91 44 – 2 – 6 49 4 25 58 4 10 37 3 (2) 11 11 (2) 41 15 (2) 17 14 – – ( ) 38 ( ) 40 – – 37 – 83 – 19 See footnote 1, table 3. Data do not meet BLS or state agency disclosure standards. 3 Data starting in November 2010 may not be comparable to prior 2 2 September September 2011 2010 2 12 10 48 4 4 8 11 2 33 July 2011 August 2011 September 2011 77,654 216,774 99,213 117,232 1,021 492 477 301 19,288 827 6,904 1,310 307 341 909 17,552 547 280 1,419 532 678 825 33,690 680 242 (2) 12,098 5,152 (2) (2) 5,176 2,447 (2) (2) 4,538 3,256 (2) 1,220 (2) 255 (2) 365 5,599 5,700 2,397 1,372 6,294 1,936 667 1,486 1,632 14,164 11,406 1,853 4,068 5,514 1,215 1,796 1,497 1,935 378 ( ) 812 6,030 1,986 607 613 1,145 2 5,092 2,179 741 334 2,202 1,554 194 617 617 2,186 419 521 1,520 306 1,026 875 363 7,381 568 14,892 8,083 583 7,739 1,206 3,435 8,610 (2) 247 1,158 228 578 1,274 (2) 6,817 338 7,506 1,624 410 2,420 (2) 3,922 (2) 836 7,830 4,985 372 1,178 12,300 323 2,724 882 2,871 ( ) 1,944 (2) (2) – 6,001 2,438 182 1,011 2 ( ) 528 476 758 412 741 1,115 – 1,638 (2) 1,635 5,890 2 ( ) 724 2 ( ) 2,137 1,607 46,009 704 713 233 (2) 7,664 5,449 – 2 – – – – 417 4,814 338 2,314 6,259 529 1,021 3,836 218 (2) 689 714 (2) 4,028 1,537 (2) 1,988 1,170 846 4,470 329 537 569 1,006 – – 2 2,985 8,060 ( ) 3,704 ( ) 3,851 – – – – 1,382 2,333 1,282 2,823 data due to a change in MLS unemployment insurance input procedures. NOTE: Dash represents zero. 2
© Copyright 2026 Paperzz