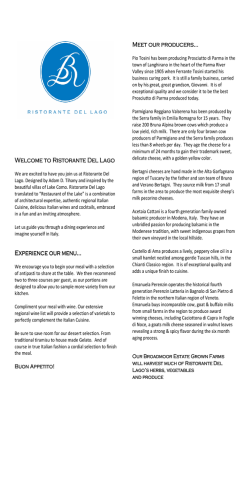
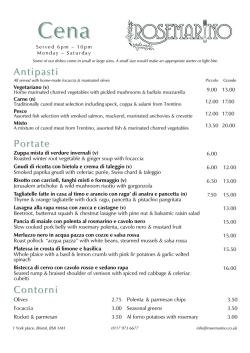
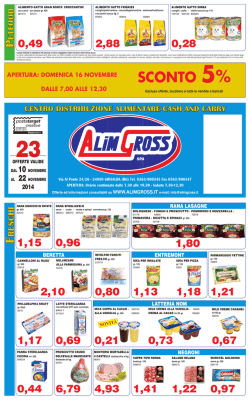
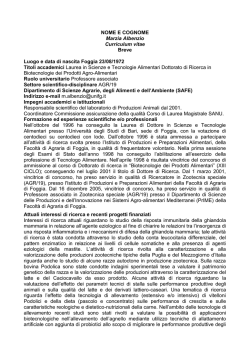
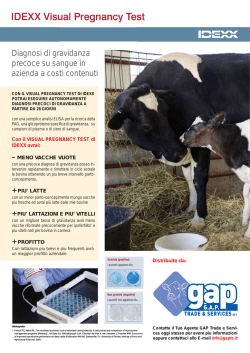
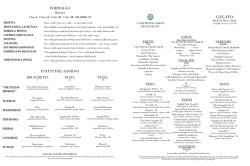
UNIVERSITÁ DEGLI STUDI DI PADOVA
Sede Amministrativa: Università degli Studi di Padova
DIPARTIMENTO DI AGRONOMIA ANIMALI ALIMENTI RISORSE
NATURALI E AMBIENTE - DAFNAE
SCUOLA DI DOTTORATO DI RICERCA IN SCIENZE ANIMALI E
AGROALIMENTARI
INDIRIZZO SCIENZE ANIMALI
CICLO XXVI
ANALYSIS OF MILK PROTEIN COMPOSITION IN
CROSSBRED AND PUREBRED DAIRY COWS
Direttore della Scuola : Ch.mo Prof. Martino Cassandro
Coordinatore d’indirizzo: Ch.mo Prof. Roberto Mantovani
Supervisore : Dott. Alessio Cecchinato
Co-supervisore: Ch.mo Prof. Giovanni Bittante
Dottorando : Alice Maurmayr
CONTENTS
Summary
Abstract
I
Riassunto
III
General Introduction
1
Aims
17
Chapter 1.
19
Chapter 2.
32
Chapter 3.
62
General Discussion and Conclusions
91
SUMMARY
Milk proteins have been widely studied in the last fifty years because of their great
importance and strong relationship with milk quality and milk coagulation properties (MCP).
The general interest in dairy science gave the possibility to achieve many important scientific
results, such as polymorphism identification concerning this kind of molecules and
differences among species and breeds. Studies which considered effects of milk protein
polymorphisms on milk characteristics and milk properties started since 1970 in such
countries like Italy, where more than 70% of milk is used in the cheese-making industry and
transformed in typical products, which play a key role for the economic valorization, like the
Protected Designation of Origin Products.
The importance of this kind of topics and the possibility to improve milk and the cheesemaking processes brought to a strong change concerning breeding value aims and selection
strategies employed in dairy science. In the last decades many farms focused on high milk
production animals, but this sort of management took to a worsening of health and functional
characteristics of the animals, such as fitness, robustness, longevity and fertility, as well as
genetic variability. Today situation get different, because an acceptable compromise was
found among farm productivity and milk quality; greater economic value was given to typical
products and local breeds were protected, because strong linked to the environmental
preservation, local tradition, and historical tradition conservation; moreover crossbreeding
schemes are employed, because they carry out very appreciable animal performances, but
breed merits are kept and at the same time some very important effect, like heterosis, are
exploited. Considering such options and lack of studies in literature, it would be desirable to
gain further knowledge on the effects of some sources of variation on milk protein fraction
and milk protein component.
Aims of the study were to find and develop a new reverse phase HPLC method able to
quantify and identify the most common milk protein fractions; to investigate the sources of
variation on milk protein fractions and composition of individual milk samples collected in
dairy herds which employed crossbreeding schemes; to investigate the sources of variation on
milk protein fractions and composition of individual milk samples collected in multi-breed
dairy herds located in mountainous areas.
A new reverse phase HPLC method for the identification and quantification of the most
common protein fractions and genetic variants of bovine milk was developed, including some
minor components, like lactoferrin. The method was validated by testing linearity and
repeatability. For genetic variants identification, milk of DNA-genotyped animals was used to
find peaks and to associate them with the known genotype of animals. Calibrations with a
coefficient of determination higher than 0.99 were obtained for every single genetic protein
variant, nevertheless commercial standards for every variant were not available.
Method was after employed for individual milk samples collected in crossbred dairy herds
located in the north of Italy and to compare pure Holstein with different bull semen of Alpine
European and Nordic breeds, like Montbeliarde, Brown Swiss and Swedish Red. It came out
that milk protein fractions, are influenced by the stage of lactation and parity; breed effect was
significant especially for κ-CN, α-LA and β-Lg, which are linked. Among crossbred
combinations, Brown Swiss and Montbeliarde crosses showed high significance, because of
the selection strategy or the natural presence of the B variant of the κ-CN, respectively; B
variant is very important in the cheese making industry because animals carrying AB or BB
genotype show a higher milk casein content and also a higher milk quality.
Method was after employed for individual milk samples collected in herds where two breeds
were attended at least; six breeds were employed, three high-production and three dualpurpose: Holstein-Friesian, Brown Swiss, Jersey and Gray Alpine, Simmental and Rendena,
respectively. Four types of dairy herd were considered in this study: modern herd type,
traditional herd type with silage use, traditional herd type without grazing use and traditional
original herd type. Effect of stage of lactation and parity influenced milk protein fractions;
among breeds, Jersey showed a higher milk protein content than the other breeds; in Gray
Alpine a new genetic κ-CN variant was detected using our reverse phase HPLC method, but
not identified, so further investigation is required to confirm this aspect, employing other
techniques maybe coupled with HPLC. Traditional dairy herd type with silage use was the
best strategy with the highest milk protein content, although it showed the highest somatic
cell content; modern herd type gave unexpectedly inferior performances and traditional herd
without grazing was instead the worse concerning milk protein content.
RIASSUNTO
Negli ultimi cinquant’anni le proteine del latte sono state oggetto di ricerca approfondita, date
le loro caratteristiche e l’importanza ad esse attribuita per quanto riguarda qualità e capacità di
coagulazione del latte. L’interesse creatosi ha reso possibile il raggiungimento di diversi
risultati di grande rilevanza scientifica, come l’identificazione di polimorfismi a livello di
queste molecole e di differenze anche piuttosto accentuate tra diverse specie e razze bovine.
Gli studi che hanno considerato gli effetti dei polimorfismi proteici sulle caratteristiche e
proprietà del latte hanno trovato ampio spazio in Italia, già a partire dai primi anni ’70, dove
gran parte del latte viene usato nell’industria lattiero-casearia e dove è fondamentale
l’ottimizzazione della produzione di prodotti trasformati e prodotti tipici, tra i quali figurano
anche i Prodotti a Denominazione di Origine Protetta.
In zootecnia la rilevanza di tali argomenti e la possibilità di migliorare considerevolmente il
latte e il suo processo di trasformazione hanno portato un profondo cambiamento per quanto
riguarda gli obiettivi e le strategie di selezione e miglioramento genetico degli animali da
reddito; nel corso degli ultimi anni molte aziende del settore si sono concentrate su animali
altamente produttivi in termini di quantità di latte prodotto, ma tale management ha portato
purtroppo ad un netto peggioramento della salute e delle caratteristiche funzionali degli
animali, quali la fitness, la rusticità, la longevità e la fertilità, oltre alla perdita di preziosa
variabilità genetica. Oggi la situazione è diversa, in quanto si è cercato di trovare un
compromesso accettabile tra produttività degli allevamenti e qualità di prodotto, investendo
economicamente nella valorizzazione di prodotti tipici e tutelando razze meno produttive, ma
fondamentali per esempio nel contesto rurale, ampiamente diffuso in Italia, proprio per le loro
caratteristiche di adattabilità e rusticità, oltre ad essere utili per la salvaguarda del territorio e
della tradizione; oppure utilizzando gli schemi di incrocio tra razze, che riescono a garantire
ottime performance degli animali, mantenendo le caratteristiche di razza e
contemporaneamente sfruttano alcuni effetti di grande utilità, come l’ eterosi. Alla luce di tali
cambiamenti, e data ancora la scarsità di informazioni presente in letteratura, è auspicabile
poter continuare ad acquisire preziose informazioni sugli effetti di alcune fonti di variazione
sulla componente proteica del latte.
Obiettivi della tesi sono stati: sviluppare e validare un nuovo metodo HPLC in fase inversa
atto a identificare e quantificare le frazioni proteiche più comuni del latte bovino; studiare gli
effetti di alcune fonti di variazioni sulle frazioni proteiche individuate con tale metodica di
latte bovino individuale proveniente da allevamenti che si servissero degli schemi di incrocio
al loro interno; studiare gli effetti di alcune fonti di variazione sulle frazioni proteiche di latte
bovino individuale proveniente da allevamenti montani multi-razza.
Un nuovo metodo di analisi HPLC in fase inversa è stato sviluppato e validato per consentire
l’identificazione e la contemporanea quantificazione delle più comuni frazioni proteiche,
comprese le loro varianti genetiche, presenti nel latte bovino, oltre a componenti minori poco
conosciute ma di grande interesse, come la lattoferrina. Tale nuova metodica è stata sottoposta
a test di linearità e ripetibilità. Per l’identificazione delle varianti è stato utilizzato latte
proveniente da animali precedentemente genotipizzati, in modo da riconoscere i picchi a
livello cromatografico ed associarli al corretto genotipo della data proteina presa in esame. E’
risultato possibile ottenere le calibrazioni corrette con un coefficiente di determinazione
superiore a 0.99 per tutte le singole varianti genetiche delle frazioni proteiche, sebbene non
fossero disponibili standard commerciali per varianti singole.
Tale metodo è stato poi applicato per l’analisi di latte individuale proveniente da allevamenti
del nord Italia che utilizzavano lo schema di incrocio di prima e seconda generazione tra razza
pura Holstein e tre differenti semi di tori del nord Europa e dell’arco Alpino, quali razza
Montbèliarde, Brown Swiss e Rossa Svedese. Dalla prova è emerso che le frazioni proteiche
del latte sono influenzate da alcune fonti di variazione come lo stadio di lattazione e l’ordine
di parto; la razza in vece influenza in particolar modo κ-CN, α-La e β-Lg, frazioni proteiche
tra loro intimamente associate. Tra gli schemi di incrocio, hanno presentato un’alta
significatività le combinazioni con la razza Bruna e la Montbeliarde, la cui selezione o la
presenza naturale rispettivamente dell’ allele B della κ-CN è di grande interesse per l’industria
di trasformazione poichè porta ad un latte di qualità maggiore, dato il contenuto più alto di
caseina totale.
Tale metodo è stato in ultimo applicato per l’analisi di latte individuale proveniente da
aziende che allevassero contemporaneamente almeno due delle sei razze scelte per la prova,
tra specializzate e a duplice attitudine, cioè razza Holstein-Friesian, Brown Swiss, Jersey e
Grigia Alpina, Pezzata Rossa e Rendena rispettivamente. Nella prova sono state considerate
anche quattro diverse tipologie aziendali, cioè l’allevamento di tipo moderno, di tipo
tradizionale con l’utilizzo di insilati, di tipo tradizionale senza la malga estiva, di tipo
tradizionale originale.
Anche in questo caso stadio di lattazione ed ordine di parto hanno influito notevolmente sulle
frazioni proteiche oggetto di studio; tra razze, la Jersey si è distinta notevolmente dalle altre,
proprio perché caratterizzata naturalmente da un latte di contenuto proteico notevolmente
alto. Nella razza Grigia è stata inoltre identificata tramite cromatografia un’ulteriore probabile
variante della κ-CN, anche se sarà necessario raccogliere maggiori informazioni servendosi
anche di tecniche complementari o accoppiate all’HPLC. La tipologia aziendale di tipo
tradizionale con uso di insilati è risultata essere la strategia migliore, dato il contenuto
proteico molto alto riscontrato nel latte, anche se è risultata la strategia con anche il più alto
numero di cellule somatiche; l’allevamento moderno inaspettatamente non ha dato le
performances migliori, mentre l’allevamento tradizionale senza uso della malga è risultato il
peggiore per quanto riguarda la componente proteica del latte.
GENERAL INTRODUCTION
Global milk production and milk consumption
Global food consumption patterns are undergoing change, especially in large parts of the
developing world, where growth and urbanization became both to increasing levels of overall
food intake; this carried out changes in composition of food consumption, with growing
shares of high-value products and of food of animal origin in particular. Growth of dietary
energy intake in the developing countries has been followed by a rapid change in diet
composition, in which consumption of livestock products has been increased.
Many factors played a key role in worldwide consumption changing of livestock products. An
important factor has been urbanization; in cities, peoples typically consume more food, such
as pre-cooked and convenient foods (Gerosa et Skoet, 2012). Moreover other social and
cultural factors have a large influence locally, like cultural preferences, natural resources
attended or not in the countries, relative costs and prices of different food commodities,
intolerances (Dong, 2006).
Looking to milk production patterns, developing country growth in demand for and
consumption of milk has been followed by an increasing production, while production in the
rest of the developed countries such as Europe and America has grown only slowly; as
explained in Figure 1, different regions contribute to vary different degrees in overall milk
production; South Asia pole plays a fundamental role in milk production, which shows a
continuous and sustained growth. Today India alone is responsible for almost a third of
developing country production. China, Latin America and Russia showed a strong increase of
milk production, but with an expanding production that seem to by slower than South Asia.
Cow milk dominates global milk production (85% of global production), but however milk
from other animals and species is very important in some countries and regions. In South Asia
(44%), buffaloes are the most important source of milk; they make a great contribution to
total production also in East Asia, especially China and in North Africa. On the other hand,
contribution of milk from goat (3%), sheep (1.5%) and camels (0.2%) is limited, but these
kinds of milk are relative significant in sub-saharian Africa and North Africa (FAO report,
2012).
Figure 1. Total milk consumption
Changes in the production systems
There are many differences between developed and developing countries; in most cases, in
developing countries milk is produced in a traditional scale system with little or absent
mechanization or technological innovations. In addition, adverse conditions for milk
production play an important role, such as high ambient temperature and humidity;
environmental characteristics imply a stronger adaptation of the animals and in many cases a
reduction in the expression of the full genetic potential of the cows. Moreover difficult access
to high-quality feed is a limiting factor. So finally an efficient management and housing
systems is required to optimize milk production and preserve health status of the animals
(McDowell, 1981).
Most developed countries have seen increasing herd size and higher milk production per cow;
many farmers adopted technological innovations to improve productivity, which often require
high capital and therefore bigger herds to be profitable. At the same time, feeding get on
different strategies, like employment of feed concentrates to reach the higher yields (Gerosa
and Skoet, 2012).
European milk production
Milk production systems vary across Europe, ranging from lowland to mountain and from
extensive to intensive (European Commission, 2000). In the last years progressive
intensification increased environmental impacts and rigorous policy planning are required to
ensure a good evaluation of the sustainability of milk production system (Ming-Jia Yan et al.,
2011). The EU is a major player in the world dairy sector; about 90% of the milk produced is
for domestic consumption of dairy products. Compared to year 2011, milk production has
increased of +0.6% in year 2012, because of the great export demand in some countries, such
as Poland, Denmark and Germany (European Commission, 2012). According to the food and
Agricultural Policy Research Institute (FAPRI, 2011), dairy market analysis outlooks from
2011 to 2020 show that milk production will continue to increasing in the next 10 years at the
average growth rate equal to the one of the past decade. The majority of the growth is
expected to come from developing countries where increasing incomes and westernization of
diets results in strong demand for dairy products; in Europe the expected trends in milk and
cheese production will be +7% for milk and +10% for cheese production. Italy is with France
the country with the highest number of locally-made cheeses, counting about 400 different
products; in Italy more than 70% of the overall milk production is used in the cheese making
industry, and almost 50% of total milk is used for PDO cheeses (Protected Designation of
Origin) production (Cassandro et al., 2003).
Aims of dairy industry
Farm animals have been undergoing human-managed selection ever since their original
domestication. Initially, selection was probably limited to docility and manageability, but
aims of selection and animal breeding changed rapidly in conjunction with human society and
requirements. In the last 60 years breeding programs focused on the genetic improvement of
production traits, such as milk yield and production. Selection was based initially on animal
phenotype, and just experience gave guidelines to obtain offspring with a superior phenotype
with few measurements. With the advent of quantitative genetics in the middle of 20th
century, a great advance in selection practice occurred, including optimized breeding schemes
based on intense bull dam selection, systematic progeny testing of bulls, and large amounts of
data (Sørensen et al., 2008) but as results, animal production industry came under dramatic
changes (Oltenacu and Broom, 2010). Concerning dairy industry, a typical example is given
by the Holstein dairy breed. Holstein was imported from north America in the late 1800s,
initially with live animals followed by semen and embryos. Exports were mainly to EU
member countries, especially Italy, the Netherlands, Germany and France. This because it
became worldwide that Holsteins gave higher milk yields than most breeds.
After that, in many countries yield per cow has more than doubled in the last 40 years,
because of the rapid progress in genetics and management. This kind of strategy brought to
long-terms problems which occur most likely in high-producing animals. As consequence a
progressive loss of genetic variability and a deterioration of functional traits, like productive
life, fertility and longevity occurred. Diseases, such as uterine infections and other disorders
which can give reproductive problems, increased, because of metabolic stress associated with
milk production. Calving interval increased from <13.0 months to > 14.5 months and number
of inseminations per conception from 2.0 to > 3.5 (Lucy, 2001).
Inbreeding results from the mating of related individuals is also increasing, with negative
effects on animal welfare; the most unfavorable effects are however inbreeding depression,
including an increase in the incidence on abnormalities caused by recessive alleles, like lethal
diseases such as bovine leukocyte adhesion deficiency (BLAD) and complex vertebral
malformations (CVM), loss of genetic variance and random drift in the population mean.
Values of many traits are reduced, such as fitness, general health status and fertility
(Thompson et al., 2000).
Finally breeding organizations implemented strategies designed to maintain genetic variability
and prevent the increase of inbreeding in the dairy population. For example, including health,
fertility and other fitness traits in the breeding objectives along with production traits, because
of the antagonistic genetic correlations between them, considering genotype by environmental
interactions, taking advantage of the molecular genetics tools already available (Mark, 2004;
Miglior et al., 2005).
Today crossbreeding for example may help to guarantee these kind of needs; crossbreeding is
the mating of individuals from different lines, breeds, or populations. The reasons to
implement breeding programs with this kind of strategy are firstly to utilize different additive
genetic levels between breeds to generate offspring with better economic ability caused by
new combinations of additive genetic components, and secondary to exploit heterosis, which
its expression carry out animals more robust and economically efficient compared with the
parental breeds (Mäki-Tanila, 2007). Initially crossbreeding was used for a long time in beef
cattle, pig and poultry production systems, but less used in dairy cattle, except New Zealand,
because of the low reproductive rate within dairy cattle (Heins, 2007).
Technological aspects of milk
After the detection of β-Lg polymorphism discovered by Aschaffenburg and Drewry (1957)
fifty years ago, scientific interest increased in dairy research; one of the most important
effects of the milk protein polymorphisms on traits with economic interest is their strong
relationship with milk composition and cheese making properties of milk, defined as milk
coagulation properties (MCP). Because of the strong importance of milk in such countries,
like Italy, where a great part of whole milk production is used in the cheese making industry,
milk coagulation properties (MCP) were widely studied until today. Coagulation properties of
milk influence cheese-making ability, cheese yield and quality (Ng-Kwai-Hang et al., 1989;
Johnson et al., 2001; Bittante et al., 2012).
As explained by Joudu et al. (2008) rennet coagulation parameters are significantly influenced
by αs1-CN, β-Cn and β-Lg contents and by casein number. Rennet coagulation time is
reduced and curd firmness is higher, along with increasing contents of the studied milk
protein fractions, including total casein and casein number.
At the same time large variability exists among MCP and other factors, such as calcium, pH
(Storry et al., 1983; Najera et al., 2003), age of the animal, stage of lactation, composition of
ration, season and breed, although results reported in literature are contradictory (Ostersen et
al., 1997; Auldist et al., 2002; Hansen et al., 2006; Wedholm et al., 2006).
Many strategies were employed to improve animal selection and milk quality, although
practical implementation possibilities are scarce. Genetic variation can be detected by
different protein identification techniques, such as electrophoretic and isoelectrophoretic
methodologies, capillary electrophoresis and chromatography (Caroli et al., 2009); detection
and quantification of genetic milk protein variants is possible through other techniques such
as near infrared spectroscopy (Laporte et al., 1998; Ferrand et al., 2012; Marinoni et al., 2013)
and predictions of MIR spectra pf milk contents were used as indicator traits in breeding
programs (Cecchinato et al., 2009; De Marchi et al., 2010) . At the DNA level, new
techniques were discovered and employed to investigate protein variants at the genome level,
like PCR-RFLP, direct sequencing, genotyping microarray, microsatellites (Damiani et al.,
1990; Chessa et al., 2007; Dalvit et al., 2008). Despite of great importance giving to MCP, a
general worsening of them has been observed in several countries; this trend was evidenced
by some authors (Mariani et al., 1992; Cassandro and Morusi, 2001; Sandri et al., 2001) and
some studies evidenced the presence of candidate genes for non-coagulating milk (Tyrisevä et
al., 2008).
Milk proteins
The major constituents of milk are either directly synthesized and secreted from the mammary
epithelial cells into the alveolar lumen or transported across the epithelial barrier from other
sources (Mather, 2011). Bovine milk contains several 200 different compounds, mostly at
trace levels. These constituents can be classified into four categories:
Organ- and species-specific constituents (lipids and principal proteins)
Organ- but non species-specific constituents (lactose)
Species- but non organ-specific constituents (some whey proteins, like WPs)
Neither organ- nor species-specific constituents, although the profile and
concentrations are species specific (water, salts, vitamins)
Bovine milk is typically made of 87% water, 3,9% fat, 3,25% protein, and 5,5% of other
molecules, like lactose. Of the 3,25% protein, approximately 80% is composed of caseins
(Walstra and Jenness, 1984; Jeng et al., 1997; Holland et al., 2010). Caseins are the most
important protein group of almost mammalian species; they are characterized by a stable
calcium phosphate binding which determines micelles complexes, large colloidal particles
with diameter ranging from <50 nm to >500 nm and an average diameter of approximately
200 nm as measured by dynamic light scattering (Frederiksen et al., 2011); they precipitate at
PH 4.6 at 20° C by acidification from raw skim milk (Farrell et al., 2004); casein composition
affects micelles structure, aggregation, enzyme activity and, above all, the milk processing in
dairy industry and cheese making process (Bramanti et al., 2002). Briefly, during renneting,
which is the moment of rennet addition to milk, two phases divide the process: firstly κ-CN is
cleaved by rennet enzymes such as the endopeptidase chymosin between the residue Phe105
and Met106; thereby, caseinomacropeptide (CMP), which is the highly hydrophilic part of the
C-terminal of κ-CN, is released into the whey, with casein micelles destabilization; the
secondary phase is non-enzymatic: the destabilized casein micelles start a calcium-dependent
spontaneous aggregation, resulting in the curd or coagulum (Green and Morant, 1981; Fox
and McSweeney, 1998; Sandra et al., 2007).
Bovine milk contains four major caseins: αs1-, αs2-, β- and κ-caseins; the concentration of
those proteins is ca. 10, 2.6, 9.3 and 3.3 mg/mL. γ-CNs are different C-terminal segments of
β-CN derived from proteolytic cleavage by the enzyme plasmin. Polar and apolar regions on
the casein peptide chains are not uniformly distributed, giving them amphiphilic structure;
moreover proline and phosphate contents bring to the ability of caseins to form micelles.
The αS1-CN family, which comprehends almost the 40% of the CN fraction, consists of one
major and one minor component. Both proteins are single-chain polypeptides with the same
amino acid sequence (Mercier et al., 1971; Grosclaude et al., 1973) and differ just on their
phosphorylation degree. The αS2-CN, which represents the 10% of the CN fraction in milk,
consists of 2 major and other minor components attending many levels of post-translational
phosphorylation. The αS2-CN is the most hydrophilic of all caseins. β-CN, almost the 45% of
total CN fraction and the most hydrophobic, is quite complex because of the action of the
native milk protease plasmin (Eigel et al.,1984). κ-CN family consists of a major
carbohydrate-free components and of 6 minor components, which represent degrees of
phosphorilation and glycosilation (Doi et al., 1979). Mollè and Lèonil (1995) found 14
glycosilated forms. The points of attachment of the oligosaccharide chains was detected at
131, 133 or 135 of Thr residues (Jollès et al., 1973).
The remaining protein components are the whey proteins; whey is composed by αlactalbumin, β-lactoglobulin, serum albumin, immunoglobulins and other proteins, with an
amount of ca. 2, 10, 1, 2 and 2% respectively (O’Donnell et al., 2004). β-Lactoglobulin is the
major protein in whey and affect properties of milk markedly; another feature is the ability to
bind molecules like palmitic acid, vitamin D, retinol (vitamin A), which is essential in
mammalian growth (Sawyer, 2003). α-LA, approximately attended at concentration of 1.2 to
1.5 g/L has a specific physiological function in the mammary gland, because interacts to form
the lactose synthase complex. Its concentration in milk decreases near the end of lactation,
and it seem to be correlated with the decline of lactose concentration.
Serum albumin (SA), Immunoglobulins (Ig) and Lactoferrin (Lf) are attended in low
concentration in bovine milk. SA plays an important role in the transport, metabolism and
distribution of ligands; bovine SA in milk is physically and immunologically identical to
blood SA. Ig group, formed by IgG, IgA and IgM, are attended in milk and above all in
colostrums, and give immunity to calf. Finally Lf, member of specific iron-binding proteins,
is attended in milk at a concentration between 20 and 200 mg/L (Plate et al., 2006).
Concentration varies and increases in response to inflammation or infection (Ashwell et al.,
2004).
Most whey proteins are globular with secondary and tertiary structure, which make them
sensitive to heat denaturation at more than 60°C of temperature, despite of caseins (Farrell et
al., 2004).
Milk protein polymorphism
Polymorphism has been observed for all milk proteins. Concerning Caseins, B variant is the
predominant variant of the αS1-CN in Bos taurus; variant C in Bos indicus and variant D in
some breeds of France (Mariani and Russo, 1975). 3 new genetic variants were identified;
variant F was found in German black and white cattle, variant G in Italian Brown cow, and
variant A, which was found in Holstein-Friesian, Red Holstein and German Red cattle (Farrell
et al., 2004). αS2-CN and α-LA have been shown to be essentially monomorphic in all
Western dairy breeds.
The κ-CN genetic variants are designed as A and B variant; the A variant seems to be
predominant in most dairy breeds, excepted the Jersey cattle (Ng-Kwai-Hang et al., 2003). B
variant is naturally predominant is such breeds like Montbeliarde or it was objective of
selection in such breeds like Brown Swiss, because its strong relationship with improved milk
clotting properties and higher cheese yield. Other variants have been detected, such as E,
which is related with unfavorable milk clotting properties, C and D variant. Concerning βCN, the most common variants are B, A1 and A2 variants. Other variants have been reported
by other works, like I, F, H a G variant. Concerning whey, β-Lg attends two genetic variants,
A and B, at high frequency in most cow breeds, and the presence of one or the other affects
milk properties, partially because the A variant is expressed at higher level than the B variant,
or the C variant (Hill et al., 1996). A new variant was detected, called variant C (Paterson et
al., 1995).
Milk protein polymorphisms play a key role in the technological properties and quality of
milk; different chemical and physical behavior and specific amino acid variations bring to
protein variation and to a different allele expression which control protein synthesis (Bonfatti
et al., 2010). Moreover several studies focused on the 6 structural genes that code milk
proteins (Caroli et al., 2009). Because casein loci are closely linked on bovine chromosome 6,
alleles of the different casein are in linkage disequilibrium; moreover, because of this,
aggregate casein genotypes has to be considered and evaluated (Hallen et al., 2008).
Genotypes of milk proteins, particularly of κ-CN and β-Lg, were found to affect milk
composition. Genetically linked mutations in the non-coding regions of κ-CN and β-Lg are
assumed to affect the transcription of κ-CN and β-Lg, respectively (Bobe et al., 2004).
Generally, B allele of κ-CN has been associated with a higher κ-CN concentration in milk,
compared to A and also with higher total protein, it is assumed that B variant is particularly
favorable to milk coagulation and syneresis (Ikonen et al., 1997). On the other hand, A allele
was associated with longer coagulation time and softer curd firmness.
B allele of β-CN seems to be related with higher total β-CN concentration, and an epistatic
effect of the β-CN casein locus on κ-CN content was detected (Graml and Pirchner, 2003).
Hallen et al (2008) found that the A1 variant of β-CN was at higher concentration that the A2
variant in milk from heterozygous A1A2 cows but no significance was found when analyzing
κ-CN genotype. Furthermore polymorphism in the promoter region of αS2-CN was found to
be associated with varying contents of αS-CN and β-CN. B allele of β-CN has been linked to
a better coagulation compared to the A variant; finally, as explained before, B variant of β-Lg
seem to be less expressed than the A variant; moreover A variant is strongly associated with a
greater relative concentration of β-LG and a lesser concentration of the other protein fractions
(McLean et al., 1984; Ng-Kwai-Hang et al., 1986; Lunden et al., 1996; Huang et al., 2012).
REFERENCES
Aschaffenburg, R and J. Drewry. 1957. Genetics of the β-lactoglobulins of cow’s milk.
Nature (Lond.). 180:376-378.
Ashwell, M. S., D. W. Heyen, T. S. Sonstegard, C. P. Van Tassel. Y. DA, P. M. Van Raden,
M. Ron, J. I. Weller, and H. A. Lewin. 2004. Detection of quantitative trait loci
affecting milk production, health, and reproductive traits in Holstein cattle. J. Dairy
Sci. 87: 468-475.
Auldist, M. J., K. A. Johnston, N. J. White, W. P. Fitzsimons, and M. J. Boland. 2004. A
comparison of the composition, coagulation characteristics and cheese making
capacity of milk from Friesian and Jersey dairy cows. J Dairy Res. 71:51-57.
Auldist, M., C. Mullins, B. O’Brien, B. T. O’Kennedy, and T. Guinee. 2002. Effect of cow
breed on milk coagulation properties. Milch-wissenschaft 57:140-143.
Bittante, G., M. Penasa, and A. Cecchinato. 2012. Invited review: Genetics and modeling of
milk coagulation properties. J. Dairy Sci. 95:6843-6870.
Bobe G., A. E. G. Freeman, G. L. Lindberg, and D. C. Beitz. 2004. Milk protein genotypes
explain variation of milk protein composition. Anim. Ind. Report ASL R1901.
Bramanti, E., C. Sortino, and G. Raspi. 2002. New chromatographic method for separation
and determination of denatured αs1-, αs2-, β- and κ-casein by hydrophobic interaction
chromatography. J. Chromatogr A. 958:157-166.
Caroli, A. M., S. Chessa, and G. J. Erhardt. 2009. Invited review: Milk protein polymorphisms
in cattle: effect on animal breeding and human nutrition. J Dary Sci. 92:5335-5352.
Cassandro, M. 2003. Status of milk production and market in Italy. Agricolturae Conspectus
Scientificus. Vol. 68(2), pp. 65-69, ISSN: 1331-7768.
Cecchinato, A., M. De Marchi, L. Gallo, and G. Bittante. 2009. Mid-infrared spectroscopy
predictions as indicator traits in breeding programs for enhanced coagulation
properties of milk. J Dairy Sci. 92: 5304-5313.
Chessa, F., F Chiatti, G. Ceriotti, A. Caroli, C. Consolandi, G. Pagnacco, and B. Castiglioni.
2007. Development of a SNP genotyping microarray platform for the identification of
bovine milk protein genetic polymorphisms, J Dairy Sci. 90:451-464.
Dalvit, C., M. De Marchi, R. Dal Zotto, E.Zanetti, T. Meuwissen, and M. CAssandro. 2008.
Genetic characterization of the Burlina cattle breed using microsatellites markers. J.
Animal Breed. Genet. 125:137-144.
Damiani, G., L. Ferretti, G. Rognoni, and V. Sgaramella. 1990. Restriction fragment length
polymorphism analysis of the kappa-casein locus in cattle. Anim. Genet. 21:107-114.
De Marchi, M., V. Bonfatti, A.. Cecchinato, G. Di Martino, and P. Carnier. 2010. Prediction
of protein composition of individual cow milk using mid-infrared spectroscopy. Ital. J.
Anim. Sci. Vol 8 (Suppl.2) 399-401.
Doi, H., F. Ibuki, and M. Kanamori. 1979. Heterogeneity of reduced bovine κ-casein. J. Dairy
Sci. 62:195-203.
Dong, F., 2006. The outlook for Asian dairy markets: The role of demographics, income and
prices. Food Pol. 31:260-271.
Eigel, W. N., J. E. Butler, C. A. Ernstrom, H. M. Farrell, Jr., V. R. Harwalkar, R. Jenness, and
R. M. Whitney. 1984. Nomenclature of proteins of cow’s milk: fifth revision. J Dairy
Sci. 67:1599-1631.
European Commission, 2012.
FAO (Food and Agriculture Organisation), 2012. Milk availability. Trends in production and
demand and medium-term outlook.
FAPRI (Food and Agricultural Policy Research Institute), 2011. Agricultural commodity
markets outlook 2011-2020. A comparative analysis.
Farrell H. M., Jr., R. Jimenez-Flores, G. T. Bleck, E. M. Brown, J. E. Butler, L. K. Creamer,
C. L. Hicks, C. M. Hollar, K. F. Ng-Kwai-Hang, and H. E. Swaisgood. 2004.
Nomenclature of the proteins of cows’ milk-sixth revision. J. Dairy Sci. 87:1641-1674.
Ferrand, M., G. Miranda, H. Larroque, O. Leray, S. Guisnel, F. Lahalle, M. Brochard, and P.
Martin. 2012. Determination of protein composition in milk by mid-infrared
spectrometry. ICAR Tech Se. 16:41-45.
Fox, P. F., and P. L. H. McSweeney. 1998. Dairy Chemistry and Biochemistry. Blackie
Academic and Professional. London, UK.
Frederiksen, P. D., K. K. Andersen, M. Hammershøj, H. D. Poulsen, J. Sørensen, M.
Backman, K. B. Qvist, and L. B. Larsen, 2011. Composition and effect of blending of
noncoagulating, poorly coagulating, and well-coagulating bovine milk from individual
Danish Holstein cows. J Dairy Sci. 94:4787-4799.
Gerosa, S., and J. Skoet. 2012. Milk availability. Trends in production and demand and
medium-term outlook. FAO working paper.
Graml, R., and F. Pirchner. 2003. Effects of milk protein loci on content of their proteins.
Arch. Tierz. Dummersdorf 46:331-340.
Green, M. L., and S. V. Morant. 1981. Mecahanism of aggregation of casein micelles in
rennet-treated milk. J. Dairy Res. 48:57-63.
Grosclaude, F., M. F. Mahè, and B. Ribadeau-Dumas. 1973. Structure primaire de la caseine
αs1-et de la caseine β-bovine. Eur. J. Biochem. 40:323-324.
Hallèn, E., A. Wedholm, A. Andrèn, and A. Lùnden. 2008. Effect of β-CN, κ-CN and βlactoglobulin genotypes on concentration of milk protein variants. J. Anim. Breed.
Genet. 125:119-129.
Hansen, J. V., N. C. Friggens, and S. Højsgaard. 2006. The influence of breed and parity on
milk yield, and milk yield acceleration curves. Livest. Sci. 104:53-62.
Heins, B. J. 2007. Impact of an old technology on profitable dairying in the 21st century.
Petersen Symposium. Pp.7-19.
Hill, J. P., M. J. Boland, L. K. Creamer, S. G. Anema, D. E. Otter, G. R. Paterson, R. Lowe,
R. L. Motion, and W. C. Thresher. 1996. Effect of bovine β-lactoglobulin phenotype
on then properties of β-lactoglobulin, milk composition, and dairy products. ACS
symposium, ser. 650, Macromolecular Interactions in food technology, pp. 281-294.
Holland B., S. Rahimi Yadzi, G. Ion Titapiccolo, and M. Corredig. 2010. Short
communication: separation and quantification of caseins and casein macropeptides
using ion-exchange chromatography. J. Dairy Sci. 93:893-900.
Huang W., F. Peñagaricano, K. R. Ahmad, J. A. Lucey, K. A. Weigel, and H. Khatib. 2012.
Association between milk protein gene variants and protein composition traits in dairy
cattle. J. Dairy Sci. 95:440-449.
Ikonen, T., M. Ojala, and E. L. Syvaoja. 1997. Effects of composite casein and βlactoglobulin genotypes on renneting properties and composition of bovine milk by
assuming an animal model. Agric. Food Sci. Finland. 6:283-294.
Jeng, S.-Y., T. G. Bleck, M. B. Wheeler, and R. Jemenez-Flores. 1997. Characterization and
partial purification of Bovine α-Lactalbumin and β-Casein produced in milk of
transgenic mice. J. Dairy Sci. 80:3167-3176.
Jollès, J., A.-M. Fiat, C. Alais, and P. Jollès. 1973. Comparative study of cow and sheep κcaseino-glycopeptides: determination of the N-tenninal sequences with a sequencer
and the location of the sugars. FEBS Lett. 30:173-176.
Johnson, M. E., C. M. Chen, and J. J. Jaeggi. 2001. Effect of rennet coagulation time on
composition, yield, and quality of reduced-fat Cheddar cheese. J. Dairy Sci. 84:10271033.
Jōudu I., M. Henno, T. Kaart, T. Püssa, and O. Kärt. 2008. The effect of milk protein
contents on the rennet coagulation properties of milk from individual dairy cows. Int.
Dairy J. 18:964-967.
Laporte, M. F., R. Martel, and P. Paquin. 1998. The near-infrared optic probe for monitoring
rennet coagulation in cow’s milk. Int. Dairy J. 8:659-666.
Lucy, M. C. 2001. Reproductive loss in high-producing dairy cattle: where will it end?. J.
Dairy Sci. 84:1277-1293.
Lundèn A., M. Nilsson, and L. Janson. 1997. Marked effect of β-lactoglobulin polymorphism
on the ratio of casein to total protein in milk. J. Dairy Sci. 80:2996-3005.
Mäki-Tanila, A. 2007. An overview on quantitative and genomic tools for utilizing
dominance genetic variation in improving animal production. Agric. Food Sci. 16:188198.
Mariani, P., p. Monatti, and S. Sandri. 1992. Contenuto di urea, pH, acidità titolabile e
caratteristiche di coagulazione del latte di singoli allevamenti. Ind. Latte 28:29963005.
Marinoni, L., L. Monti, S. Barzaghi, and B. de la Roza-Delgado. 2013. Quantification of
casein fractions and of some of their genetic variants in phosphate buffer by near
infrared spectroscopy. J. Near Infrared Spectrosc. 21:385-394.
Mark, T. 2004. Applied genetic evaluations for production and functional traits in dairy cattle.
J. Dairy Sci. 87:2641-2652.
Mather, I. H., 2000. A review and proposed nomenclature for major proteins of the milk-fat
globule membrane. J. Dairy Sci. 83: 203-247.
McDowell, R. E. 1981. Limitations for dairy production in developing countries. J. Dairy Sci.
64:2463-2475.
Mclean D. M., E. R. Graham, R. W. Ponzoni, and H. A. McKenzie. 1984. Effects of milk
protein genetic variants on milk yield and composition. J. Dairy Res. 51:531-546.
Mercier, J.-C., F. Grosclaude, and B. <<ribadeau-Dumas. 1971. Structure primaire de la
casein αs1 bovine. Sequence complete. Eur. J Biochem. 23:41-51.
Miglior, F., B. L. Miur, and B. J. Van Doormaal. 2005. Selection indices in Holstein cattle of
various countries. J. Dairy Sci. 88:1255-1263.
Ming-Jia, Y., J. Humphreys, and N. M. Holden. 2011. An evaluation of cycle assessment of
European milk production. J. Enviromental Manag. 92:372-379.
Mollè, D., and J. Léonil. 1995. Heterogeneity of the bovine κ-casein caseino-macropeptide,
resolved by liquid chromatography on-line with electrospray ionization mass
spectrometry. J. Chromatogr. A. 708:223-230.
Najera, A. I., M. De Renobales, and L. J. R. Barron. 2003. Effects of pH, temperature, CaCl2
and enzyme concentrations on the rennet-clotting properties of milk: a multifactorial
study. Food Chem. 80:345-352.
Ng-Kwai-Hang, K. F., J. F. Hayes, J. E. Moxley, and H. G. Monardes. 1986. Relationships
between milk protein polymorphisms and major milk constituents in Holstein-Friesian
cows. J. Dairy Sci. 69:22-26.
Ng-Kwai-Hang, K. F., I. Politis, R. I. Cue, and A. S. Marziali. 1989. Correlation between
coagulation properties of milk and cheese yielding capacity and cheese compostion.
Can. Inst. Food Sci. Technol. 22:291-294.
O’Donnell, R., J. W. Holland, H. C. Deeth, and P. Alewood. 2004. Milk Proteomics. Int.
Dairy J. 14:1013-1023.
Oltenacu, P. A., and D. M. Broom. 2010. The impact of genetic selection for increased milk
yield on the welfare of dairy cows. Anim. Welf. 19:39-49.
Ostersen S., J. Foldager, and J. E. Hermansen. 1997. Effects of stage of lactation, milk protein
genotype and body condition at calving on protein composition and renneting
properties of bovine milk. J. Dairy Res. 64:207-219.
Paterson, G. R., J. P. Hill, and D. E. Otter. 1995. Separation of β-lactoglobulin A, B and C
variants of bovine whey using capillary zone electrophoresis. J. Chromatogr. A
700:105-110.
Plate, K., S. Beutel, H. Buchholz, W. Demmer, S. Fischer-Frühholz, O. Reif, R. Ulber, and T.
Scheper. 2006. Isolation of bovine lactoferrin, lactoperoxidase and enzymatically
prepared lactoferricin from proteolytic digestion of bovine lactoferrin using adsorptive
membrane chromatography. J. Chromatogr. A. 1117:81-86.
Sandra, S., M. Alexander, and D. G. Dalgleish. 2007. The rennet coagulation mechanism of
skim milk as observed by transmission diffusing wave spectroscopy. J. Colloid
Interface Sci. 308:364-373.
Sandri, S., F. Tosi, P. Mariani, P. Vecchia, M. Malacarne, and A. Summer. 2001.
Observations on the trend of the main dairy-characteristics of Parmigiano-Reggiano
cheese milk during the years 1990-2001. Animali della Facoltà di Medicina
Veterinaria, Università degli Studi di Parma, vol XXI, 235-247.
Sawyer, L. 2003. β-lactoglobulin. Advanced Dairy Chemistry. Vol. 1 Proteins, pp. 319-386.
Ed. Kluwer Academic/Plenum Publisher, New York, NY.
Sørensen, M. K. E. Norberg, J. Pedersen, and L. G. Christensen. 2008. Invited review:
Crossbreeding in dairy cattle: a Danish perspective. J. Dairy Sci. 91:4116-4128.
Storry, E. J., A. S. Grandison, D. Millard, A. J. Owen, and G. D. Ford. 1983. Chemical
composition and coagulating properties of renneted milks from different breeds and
species of ruminants. J. Dairy Res. 50: 215-229.
Thompson, J. R., R. W. Everett, and N. L. Hammerschmidt. 2000. Effects of inbreeding on
production and survival in Holsteins. J. Dairy Sci. 83:1856-1864.
Tyrisevä, A. M., K. Elo, A. Kuusipuro, V. Vilva, I. Jänönen, H. Karjalainen, T. Ikonen, and
M. Ojala. 2008. Chromosomal regions underlying noncoagulation of milk in Finnish
Ayrshire cows. Genetics 180(2), 1211-1220.
Walstra, P. 1999. Casein sub-micelles: do they exist?. Int. Dairy J. 9(3-9):189-192.
Wedholm, A., L. B. Larsen, H. Lindmark-Mänsson, H. Karlsson, and A. Andrén. 2006.
Effect of protein composition on the cheesemaking properties of milk from individual
dairy cows. J. Dairy Sci. 89:3296-3305.
AIMS
The general aim of the thesis was to gain further knowledge about milk protein fraction and
milk protein composition in crossbred and purebred dairy cows. The effects of some sources
of variation were investigated to better understand changes and relationships between milk
proteins and milk proportion considering different crossbreeding combinations and different
dairy managements in multi-breeds dairy herds; moreover it was needed to clarify the specific
properties of protein fractions and their genetic variants on the productive performances of the
animals.
Specific aims were to:
Develop a reverse phase HPLC method for the identification and quantification of the
most common milk protein fractions and their genetic variants (Chapter 1)
Investigate the sources of variation on milk protein fractions and composition of
individual milk samples collected in dairy herds which employed crossbreeding
schemes (Chapter 2)
Investigate the sources of variation on milk protein fractions and composition of
individual milk samples collected in multi-breed dairy herds located in mountainous
areas (Chapter 3)
CHAPTER 1.
Detection and quantification of
S1-,
S2-,
-, κ-casein, -
lactalbumin, β-lactoglobulin and lactoferrin in bovine milk by
reverse-phase high-performance liquid chromatography
Alice MAURMAYR, Alessio CECCHINATO, Luca GRIGOLETTO and Giovanni
BITTANTE
Department of Agronomy, Food, Natural Resources, Animals and Environment
Viale dell’Università 16, 35020 Legnaro (PD), Italy
Published in Agriculturae Conspectus Scientificus (2013) 78:201-205
Detection and quantification of
S1-,
S2-,
-, κ-casein, -lactalbumin, β-lactoglobulin
and lactoferrin in bovine milk by reverse-phase high-performance liquid
chromatography
Alice MAURMAYR, Alessio CECCHINATO, Luca GRIGOLETTO and Giovanni
BITTANTE
DAFNAE - Department of Agronomy, Food, Natural Resources, Animals and Environment
Viale dell’Università 16, 35020 Legnaro (PD), Italy
Corresponding author: Alice MAURMAYR, Viale dell’Università 16, 35020 Legnaro (PD),
Italy; +390498272614, [email protected]
SUMMARY: Bovine milk proteins has been widely studied because of the strong association
and relationship with composition and technological properties of milk. Cow’s milk quality is
very important, above all in such countries like Italy, where about 70% of whole milk
production is used in cheese-making industry. A reversed-phase high-performance liquid
chromatography (RP-HPLC) method was developed to identify and quantify rapidly the most
common genetic variants of bovine milk proteins, included lactoferrin. A reverse-phase
analytical column C8 (Aeris WIDEPORE XB-C8, Phenomenex, 3,6 μm, 300Å, 250 x 2,1
I.D.) was used for the analysis. All the most common casein (CN) and whey protein genetic
variants were detected and separated simultaneously in less than 20 min; purified bovine milk
protein genetic variants were employed in calibration. A linear relationship (R2 >0.99%)
between concentration and peak areas of individual milk protein variants was observed.
Key words: bovine casein, whey protein, lactoferrin, genetic variants, HPLC
AIM – Several methods were employed to analyze milk protein fractions, such as
electrophoretic techniques (Veloso et al., 2002), proteomic approaches (Jensen et al., 2012)
isoelectring focusing (IEF) (Strange et al., 1992), ion-exchange HPLC chromatography
(Holland et al., 2010) or HPLC chromatography coupled with mass spectrometry (Bonizzi et
al., 2009; Mollè et al., 2009). Previous investigations focused on the separation of bovine
milk protein fraction, overlooking the quantification of single milk protein genetic variants
with few exceptions (Bonfatti et al., 2008); furthermore very few studies focused on other
minor components, like lactoferrin (Palmano et al., 2001) and BSA, and generally are time
consuming. The aim of this study was to develop an RP-HPLC method able to identify and
quantify the single genetic variants of protein fractions, included some minor components
such as lactoferrin, improving the run time analysis of chromatograms, even so ensuring good
separation of protein fractions and high resolution. Validation of the method includes testing
linearity.
MATERIALS AND METHODS – The present study is part of a larger project aimed at the
study of relationships between quality and technological traits of milk of Brown Swiss cows
(Bittante, 2012; Bittante et al., 2011a, b, and 2013; Cecchinato et al., 2009, 2011, 2012a, b;
Cipolat et al., 2012; Macciotta et al., 2012; Maurmayr et al., 2011).
Guanidine hydrochloride (GdnHcl) (lot G-4505, purity >99%), Bis-tris Buffer (lot B-9754,
>98%), Trifluoroacetic acid (lot T-6508,>99%), sodium citrate (lot 71498, >99%) and DLDithiothreitol (lot 43817, >99%) were supplied by Sigma (Sigma-Aldrich, St. Louis, MO,
USA). Purified major protein from bovine milk were purchased from Sigma: -CN (lot C0406, >80%), -CN (lot C-6780, >70%), -CN (lot C-6905, >90%), -La (lot L-5385 type I,
~85%), β-LgB (lot L-8005, >90%), β-LgA (lot L-7880, >90%) and lactoferrin (lot L-9507,
>85%). Ultra pure water (Milli-Q System, >18,2 MΩ cm) was obtained in the laboratory.
Individual and bulk bovine milk was collected directly in dairy herds. Preservative (Bronopol,
2-bromo-2nitropropan-1,3-diol) was added to raw milk samples to prevent microbial growth
and 2 aliquots for each sample containing 1 ml of milk were frozen at -20°C during milk
collection and transferred at -80°C in the laboratory since the HPLC analysis was performed.
Milk samples were prepared following the method of Bobe et al. (1998). No preliminary
separation or precipitation procedures of the casein fraction was required.
The HPLC equipment consisted of an Agilent 1260 Series chromatograph (Agilent
Technologies, Santa Clara, CA, USA) equipped with a quaternary pump (Agilent 1260 Series,
G1311B). A Diode Array Detector (Agilent 1260 Series, DAD VL+, G1315C) was used. The
equipment was controlled by the Agilent Chemstation for Lc System software which sets
solvent gradient, data acquisition and data processing. Separation was performed on a
reversed-phase analytical column C8 (Aeris WIDEPORE XB-C8, Phenomenex) with a large
pore core-shell packing (3,6 μm, 300Å, 250 x 2,1 I.D.). A Security Guard ULTRA Cartridge
System (product No. AJ0-8785, Phenomenex) was used as pre-column (UHPLC WIDEPORE
C8, 2,1 mm I.D.). Sample vials were kept at low constant temperature (4°C) and injected via
an auto-sampler (Agilent 1100 Series, G1313A).
After comparing different chromatographic conditions, the followed was adopted to optimize
analytical quality and time required: a) gradient elution was carried out with a mixture of two
solvents: solvent A consisted of 94.9% water, 5.0% acetonitrile and 0,1% trifluoroacetic acid
and Solvent B consisted of 0,1% TFA in acetonitrile; b) separation of bovine protein fraction
was performed with the following program: linear gradient from 20 to 29 % B in 0.5 min,
from 29 to 33% B in 5.5 min, from 33 to 36% B in 6 min, from 36 to 45% B in 6 min and
return linearly to the starting condition in 1 min; c) the column was re-equilibrated under
starting conditions for 3 min, before inject the following sample and the total analysis time
per sample was 22 min; d) the flow rate was 0.5 ml/min; e) the column temperature was kept
at 70°C; f) the detection was made at a wavelength of 214 nm; and g) the injection volume
consisted of 2 μl.
Concerning standard solutions, single-fraction mother solutions were prepared by dissolving,
respectively, 5 mg of purified -CN, 2,5 mg of purified -CN, 4 mg of purified β-CN, 1.5 mg
of purified lactoferrin, 1 mg of purified -La, 2 mg of both purified β-Lg A and B in 0.75 ml
of GndHcl solution; then, a set of five decreasing concentration solutions was obtained by
each single mother solution by applying the dilution scheme reported in table 1.
TABLE 1: Diluition scheme and composition of the casein fraction concentration standards
Standard
level
5
4
3
2
1
Diluition (ml)
0.75
1.5
2.25
3
3.75
Fraction concentration (mg)
k-CN
α s-CN
2.5
1.87
1.40
1.05
0.79
5
3.75
2.81
2.10
1.58
a
β -CN
Lfe
α - La
β – Lg A
β – Lg B
4
3
2.25
1.68
1.26
1.5
1.12
0.84
0.63
0.47
1
0.75
0.56
0.42
0.31
2
1.5
1.12
0.84
0.63
2
1.5
1.12
0.84
0.63
a: for quantification it was applied the 4:1 proportion between αs1 and αs2 fractions
The resulting standard solutions were analyzed in order to construct the
lactoferrin,
-La, β-LGA-B calibration curves. Since
s1
and
proteins, the corresponding values were calculated from the
S1-S2,
β and -CN,
s2
are not available as single
s
applying the 4:1 proportion
known for cow milk (Bonizzi et al., 2009). Before calibration, linearity was tested by running
the same sample at the five dilution points in triplicate. Areas under peaks of the
chromatogram were used to validate the method. Concerning validation procedure, 30
individual milk samples were analyzed and every sample was run two times repeating the
analysis of the same sequence (sample injection=2 µl). The external standard method was
used for the calibration of the chromatographic system for the protein quantification.
Calibration curves were computed for each protein genetic variant by applying simple linear
regression of the peak area on the amount injected, at decreasing injection volume. Results are
reported in Table 2.
TABLE 2: Parameters of regression equation curves for single protein genetic variants or protein
fractiona
b
2
STANDARD
MEAN
DS
b
a
RDS
R
K-CN A
K-CN B
763.4
665.4
399.80
289.05
583.41
420.56
-126.30
24.5
49.91
42.18
0.99
0.99
α S2-CN 1
658.23
347.24
252
-109.62
51.54
0.99
α S2-CN 2
624.48
377.88
276.20
-217.11
33.24
0.99
α -S1-CN B
4517.04
2722.79
1992.43
-1553.88
203.72
0.99
α -S1-CN C
1873.38
1107.25
809.47
-593.06
95.85
0.99
Lactoferrin
3446.56
1594.40
3885.93
-101.29
91.46
0.99
β-CN B
513.22
321.50
293.06
-205.54
25.86
0.99
β-CN -A1
2425.84
1329.91
1215.76
-555.94
35.57
0.99
β-CN -A2
4469.56
2031.04
1854.79
-79.51
106.65
0.99
α- LA
2146.29
1167.42
4279.76
-461.79
76.49
0.99
β-Lg A
1887.22
1206.06
2189.63
-799.89
137.18
0.99
β-Lg B
2682.68
1679.44
3053.04
-1073.78
71.83
0.99
a Separated solutions of purified protein genetic variants at different concentration in duplicate
b Residual standard deviation
RESULTS AND DISCUSSION – All major peaks and chromatograms are reported in
Figure 1.
HPLC conditions were optimized for mobile phase conditions, gradient, flow rate and
temperature. Retention times of the major eluted peaks coincided with the retention times of
the major milk proteins present in standards. It was ascertained that proteins eluted following
this order: -CN,
S2-CN,
S1-CN,
lactoferrin, -La, β-CN and β-Lg.
The identification of peaks of genetic variants was confirmed comparing them with
commercial standards which consisted of purified genetic variants (just for - Lg variants are
available, A and B respectively) or comparing them with chromatograms of individual milk
samples of DNA-genotyped animals. The -CN eluted as three distinct peaks which consisted
of glycosylated and unglycosylated forms of
-CNA and
-CNB. Chromatograms with a
different -CN genetic variants were well resolved , variant A and B are evident, although the
infrequent variant -CNE coeluted with the A variant using the current method; -CNE variant
is a uncommon variant which exhibits a high frequency in the Finnish Ayrshire (Ikonen et al.,
1996), but not in Brown Swiss or Holstein Friesian breeds (Bittante et al. 2012). The genetic
variants of this protein fraction showed an effect also on cheese yield and quality (Alipanah
and Kalashnikova, 2007; Bonfatti et al., 2011). Between -CN A/E and
S2-CN,
-CNB peaks eluted
which consisted of two major peaks; multiple peaks and shoulders of
probably caused by the partial separation of many phosphorylated forms of
S2-CN
S2-CN
are
(Bordin et
al., 2001).
Separation of
S1 variant
B and C was enough feasible with the current method ( the height of
the inflection point between the two peaks is respectively the fifth part of the first peak B
variant and the second part of the second peak C variant). In the current analysis it was not
found an animal carrying
S1-CN
A or
S1-CN
D variants. Separation of lactoferrin was well
resolved, retention time and peak area is the same for the sample of unknown amount and the
standard used for calibration curves, although peak area of lactoferrin is very small because
of the very low amount of this iron-binding protein in bovine milk (20-200 mg/L) (Farrell et
al., 2004; Plate et al., 2006). -La eluted after
S1-CN
and it showed monomorphic peak in
variant B in all samples analyzed.
Concerning -CN, B, A1 and A2 variants eluted after -La and all peaks were identified and
well resolved. The C variant coeluted with A1 variant and it was not detectable with the
current method; the A3 variant, which coeluted with the A2 variant was detected with the
current method; there is another variant that eluted between A1 and A2 variant which is not
named because of their absence in milk samples of DNA-genotyped animals that were used
for the identification and detection of the major milk protein genetic variants during the
validation procedure of the method.
For β-Lg, variant B eluted before variant A; this last one has got a peak followed by a main
one and the proportions of the area between these two peaks can be considered as an indicator
of proteolysis (Bordin et al., 2001). Comparing the injections of standards, BSA eluted
between lactoferrin and -La, and Ig eluted at the end of the chromatographic run, after β-Lg.
It was not possible to detect and quantify both BSA and Ig during the analysis of milk
samples, although peaks were better resolved and visible analyzing colostrums; however
colostrum seems to need a different preparation or a different method development to detect
other proteins, such as BSA and Ig, which are in low proportion in milk, but in high level at
the beginning of the lactation (Farrell et al., 2004).
Concerning quantification, calibration curves have been derived from parameters of simple
linear regression computed for whole protein fraction by using commercial standards.
Considering all the five-point calibration setting used for each standard at five different
dilutions, the relation between peak area and injected amount of protein variant was linear (R2
> 0.99%).
Concerning milk sample, CN content was nearly 84% of total protein. Within caseins, αs-CN
was ca. 42% of the total casein fraction, whereas k-CN was 19% and β-CN was 37% of total
casein fraction, whereas the β-Lg was 84% of the total whey protein. The CN content of
samples as a proportion of total protein content in our study was greater than the casein index
reported by other studies because non-protein nitrogen, proteose-peptones and minor
constituents of whey protein cannot be quantified with this method.
FIGURE 1: Chromatograms relative to individual raw milk samples (samples 1-5) obtained using the
optimized elution condition descrive in matherials and method section
Fig. 1. Chromatograms of different individual milk samples; no 1: k-CN A; no 2: α s2-CN ; no 3: k-CN B;
no 4: α s1-CN B; no 5: α s1-CN C; no 6: Lactoferrin; no 7: α-La; no 8: β-CN B; no 9: β-CN A1; no 10: β-CN
A2; no 11: β-CN A3; no 12: β-Lg B; no 13: β-Lg A
CONCLUSIONS - A RP-HPLC method was developed to identify and quantify the most
common milk protein genetic variants of cows. The method guarantied the detection and the
quantification of all major milk protein fractions, included some minor components like
lactoferrin, and their main genetic variants in one fast run with good resolution. It allows a run
time equal or lower than halved if compared to methods proposed earlier.
In conclusion this method can be applied to analysis of raw individual and bulk milk samples;
preparation procedure is very easy and fast and the total analysis time per sample is short (22
min) considering the amount of information that could be collected: concentration of different
protein fractions of milk, separately for each main genetic variants, and thus also genotype of
animals for the gene codifying for protein fractions can be derived. This methodology can
favor new understanding on the complex relationships among protein fractions and variants,
milk quality, milk coagulation, cheese yield and quality.
ACKNOWLEDGEMENTS - The Authors wish to thank the Autonomous Province of
Trento for funding the project
REFERENCES:
Alipanah, M., Kalashnikova, L.A. (2007). Influence of k-casein genetic variant on cheese
making ability. J Anim Vet Advances 6: 855-857
Bittante G. (2012). Modeling rennet coagulation time and curd firmness of milk. J Dairy Sci
94: 5821-5832
Bittante G., Cecchinato A., Cologna N., Penasa M., Tiezzi F., and De Marchi M. (2011a).
Factors affecting the incidence of first-quality wheels of Trentingrana cheese. J Dairy
Sci 94: 3700-3707
Bittante G., Cologna N., Cecchinato A., De Marchi M., Penasa M., Tiezzi F., Endrizzi I., and
Gasperi F. (2011b). Monitoring of sensory attributes used in the quality payment
system of Trentingrana cheese. J Dairy Sci 94: 5699-5709
Bittante G., Contiero B., Cecchinato A. (2013). Prolonged observation and modelling of milk
coagulation, curd firming, and syneresis. Int Dairy J 29: 115-123
Bittante G., Penasa M., and Cecchinato A. (2012). Invited review: Genetics and modeling of
milk coagulation properties. J Dairy Sci 95: 6843-6870
Bobe G., Beitz D. C., Freeman A. E., Lindberg G. L. (1998). Separation and quantification of
bovine milk proteins by reversed-phase High Performance Liquid Chromatography. J
Agric Food Chem 46: 458-463
Bonfatti V., Cecchinato A., Di Martino G., De Marchi M., Gallo L., Carnier P. (2011) Effect
of k-casein on Montasio, Asiago and Caciotta cheese yield using milk of similar
protein composition. J Dairy Sci 94: 602-613
Bonfatti V., Grigoletto L., Cecchinato A., Gallo L., Carnier P. (2008). Validation of a new
reversed-phase high-performance liquid chromatography method for separation and
quantification of bovine milk protein genetic variants. J Chromatogr A 1195: 101-106
Bonizzi I., Buffoni J. N., Feligini M. (2009). Quantification of bovine casein fractions by
direct chromatographic analysis of milk. Approaching the application to a real
production context. J Chromatogr 1216: 165-168
Bordin G., Cordeiro Raposo F., de la Calle B., Rodriguez A. R. (2001). Identification and
quantification of major bovine milk proteins by liquid chromatography. J Chromatogr
A 928: 63-76
Cecchinato A., Cipolat-Gotet C., Casellas J.,. Penasa M., Rossoni A., and Bittante G. (2012a).
Genetic analysis of rennet coagulation time, curd-firming rate, and curd firmness
assessed on an extended testing period using mechanical and near-infrared
instruments. J Dairy Sci 96: 50-62
Cecchinato A., De Marchi M., Gallo L., Bittante G., and Carnier P. (2009). Mid-infrared
spectroscopy predictions as indicator traits in breeding programs for enhanced
coagulation properties of milk. J Dairy Sci 92: 5304–5313
Cecchinato A., Penasa M., De Marchi M., Gallo L., Bittante G., and Carnier P. (2011).
Genetic parameters of coagulation properties, milk yield, quality, and acidity
estimated using coagulating and noncoagulating milk information in Brown Swiss and
Holstein-Friesian cows. J Dairy Sci 94: 4214-4219
Cecchinato A., Ribeca C., Maurmayr A., Penasa M., De Marchi M., Macciotta N. P. P., Mele
M., Secchiari P., Pagnacco G., and Bittante G. (2012b). Short communication: Effects
of β-lactoglobulin, stearoyl-coenzyme A desaturase 1, and sterol regulatory element
binding protein gene allelic variants on milk production, composition, acidity and
coagulation properties of Brown Swiss cows. J Dairy Sci 95: 450-454
Cipolat-Gotet C., Cecchinato A., De Marchi M., Penasa M., and Bittante G. (2012).
Comparison between mechanical and near-infrared optical methods for assessing milk
coagulation properties. J Dairy Sci 95: 6806–6819
Farrell H. M., Jimenez-Flores R., Bleck G. T., Brown E. M., Butler J. E., Creamer L. K.,
Hicks C. L., Hollar C. M., Ng-Kwai-Hang K. F., Swaisgood H. E. (2004).
Nomenclature of the proteins of Cows’ milk – Sixth Revision. J Dairy Sci 87: 16411674
Holland B., Rahimi Yazdi S., Ion Titapiccolo G., Corredig M. (2010). Short communication:
separation and quantification of caseins and casein macropeptide using ion-exchange
chromatography. J Dairy Sci 93: 893-900
Ikonen T., Ruottinen O., Erhardt G., Ojala M. (1996). Allele frequencies of the major milk
proteins in the Finnish Ayrshire and detection of a new
-casein variant. Anim Genet
27: 179-181
Jensen H. B., Holland J. W., Poulsen N. A., Larsen L. B. (2012). Milk protein genetic variants
and isoforms identified in bovine milk representing extremes in coagulation
properties. J Dairy Sci 95: 2891-2903
Macciotta N.P.P., Cecchinato A., Mele M., and Bittante G. (2012). Use of multivariate factor
analysis to define new indicator variables for milk composition and coagulation
properties in Brown Swiss cows. J Dairy Sci 2012: 7346-7354
Maurmayr A., Ribeca C., Cecchinato A., Penasa M., De Marchi M., and Bittante G. (2011).
Effects of Stearoyl-CoA Desaturase 1 and Sterol Regulatory Element Binding Protin
gene polymorphism on milk production, composition and coagulation properties of
individual milk of Brown Swiss cows. Agric Conspectus Scientificus 76: 235-237
Palmano K. P., Elgar D. F. (2002). Detection and quantification of lactoferrin in bovine whey
samples by reversed-phase high-performance liquid chromatography on polystyrenedivinylbenzene. J Chromatogr A 947: 307-311
Plate K., Beutel S., Buchholz H., Demmer W., Fischer-Früholz S., Reif O., Ulber R., Scheper
T. (2006). Isolation of bovine lactoferrin, lactoperoxidase and enzimatically prepared
lactoferricin from proteolytic digestion of bovine lactoferrin using adsorptive
membrane chromatography. J chromatogr A 1117: 81-86
Strange, E. D., Malin E: L., Van Hekken D. L., Basch J. J. (1992). Chromatographic and
electrophoretic methods used for analysis of milk proteins. J Chromatogr A 624: 81102
Veloso A. C. A., Teixeira N., Ferreira I. M. P. L. V.O. (2002). Separation and quantification
of
the
major
casein
fractions
by
reverse-phase
high-performance
liquid
chromatography and urea-polyacrylamide gel electrophoresis Detection of milk
adulterations. J Chromatogr A 967: 209-218
.
CHAPTER 2.
Effect of days in milk, parity and crossbred combinations of
purebred Holsteins and first/second-generation crossbred cows
from Swedish Red, Montbèliarde and Brown Swiss bulls on milk
protein fractions and composition
Alice Maurmayr, Francesca Malchiodi, Giovanni Bittante, and Alessio Cecchinato
Department of Agronomy, Food, Natural Resources, Animals and Environment
Viale dell’Università 16, 35020 Legnaro (PD), Italy
Submissed to the Journal of Dairy Science
Effect of days in milk, parity and crossbred combinations of purebred Holsteins and
first/second-generation crossbred cows from Swedish Red, Montbèliarde and Brown
Swiss bulls on milk protein fractions and composition
Alice Maurmayr*, Francesca Malchiodi*, Giovanni Bittante*, and Alessio Cecchinato*
*Department of Agronomy, Food, Natural Resources, Animals and Environment
Viale dell’Università 16, 35020 Legnaro (PD), Italy
ABSTRACT
The aim of this study was to investigate the effect of some environmental source of variation
and of crossbreeding on the proportion and amount of the most common milk protein
fractions, included some minor components like lactoferrin. A total of 505 individual milk
samples were collected during evening milking (2 to 3 sampling days per herd) in three
commercial farms located in Northern Italy. The three farms have followed crossbreeding
programs on part of their cows, even if most of the animals were purebred Holstein (H). The
basic scheme was a three-breed rotational based on the use of Swedish Red (S) semen on H
cows (S × H), Montbeliarde (M) semen on S × H cows [M × (S × H)], and again H semen on
M × (S × H). In all herds, a smaller proportion of purebred H were mated inverting the breed
order (M × H and S × (M × H)) or using Brown Swiss (B) bulls (B × H), and then M bulls (M
× (B × H)). Milk samples were analyzed by reverse-phase high performance liquid
chromatography and protein fractions amount (g/L) and proportion (% of total true protein)
were obtained. Traits were analyzed by using a linear model including the fixed effects of
herd-test-day, parity, days in milk and breed combination. The traits considered in this work
showed generally normal distribution, with the exception of lactoferrin which showed an
asymmetrical distribution. All milk protein fractions were influenced by the stage of lactation
and parity; the increase of protein concentration during lactation id due especially to β-CN,
lactoferrin and β-Lg. The greater protein content of heifers’s milk is due to an increase of all
casein fractions and partly to α-LA. The higher protein content of crossbred cows respect to
purebred Holsteins was due especially to an increase of κ-CN, α-LA, and β-LG. The threeway crossbreds differed from two-way crossbred only for a greater proportion of α-LA of
their milk. Within the three-way crossbred cows, the S sired ones yielded milk with a smaller
content and proportion of β-LG respect to the M sired cows and, consequently, by a higher
proportion of caseins respect to whey proteins.
Key words: crossbreeding, casein fractions, whey proteins, lactoferrin, Swedish Red,
Montbeliarde.
INTRODUCTION
Bovine milk contains almost ~3.5 % protein, but this level varies substantially with
breed, individuality, health and nutritional status of the animal. Almost 80% is composed of
caseins, corresponding to 2.5–2.8%, w/v (Holland et al., 2010). Caseins are the most
important proteins as for quantitative, technological and nutritional aspects. The major
proteins belonging to this group are usually referred to as αs1-, αs2-, β- and κ-fractions
(Bonizzi et al., 2009) characterized by a stable calcium phosphate binding which determines
micelles complexes (Farrell et al., 2004). It is demonstrated that genetic, environmental and
management factors represent sources of variability in the milk protein content (Martin et al.,
2002, Summer et al., 2003). Whey proteins are described as the group of milk protein that
remain soluble in serum or whey after precipitation of milk casein at pH 4.6; β-Lactoglobulin
(β-Lg), α-Lactoalbumin (α-LA), serum albumin, Immunoglobulins, Lactoferrin (Lf), and
proteose-peptone fractions have been considered the major characterized components of whey
(Ng-Kwai-Hang et al., 2003).
Casein are responsible of curd formation after rennet addition and consequently of
cheese yield; milk was designed to coagulate in the neonatal stomach, which is achieved
through limited proteolysis of the micelle-stabilizing protein, κ-CN, by a specific gastric
proteinase, chymosin (Fox, 2011). Despite the lower economic importance, also whey
proteins have peculiar nutritional and physiological properties; BSA is a leakage protein from
blood, while Igis transported selectively from blood into colostrums and gives passive
immunity on the young of species who do not receive Ig in utero. Finally, few studied,
lactoferrin, an iron-binding protein with antimicrobial and antifungal activity. So,
modification of content, proportion and daily yield of milk protein fractions can be very
important in nutritional, technological and economic terms according to the destination of
milk and of the characteristics of the market.
The genetic polymorphism within the caseins and the whey proteins has been
demonstrated and it determines the improvement or the worsening of some characteristics of
milk, like curd-firming capacity, syneresis ability, whey drainage and cheese making
properties (Bittante et al., 2012; Cecchinato et al., 2011 ; Jensen et al., 2012). In literature
several works investigated associations of milk protein polymorphisms with protein
composition and cheese making properties of milk (Bonfatti et al., 2010, Mayer et al., 1997;
Wedholm et al., 2006; Bonfatti et al., 2010; Cecchinato et al., 2011; Bittante et al., 2012).
Breeding for milk protein genotypes has been suggested as a practical way to selection
and to change the composition of the milk protein fraction; Selection and crossbreeding are
the two strategies that can be employed to alter genetically the yield of milk and its
components (Lopez-Villalobos et al., 2000). In the past, in most countries the high selection
pressure was focused just to improve productivity of the animals and this kind of strategy
brought as consequence to a progressive decrease milk quality traits and a deterioration of
functional traits. Success of selection for milk production has contributed to the spreading of
the Holstein breed around the world, but now are known the heavy consequences of this
diffusion on important traits like milk quality, productive life, fertility and longevity. Today
different selection indices, breeding value estimation techniques, and mating schemes ensure
a better management of dairy cows and their genetic richness, including milk quality and
functional traits such as fertility, health, calving ease, and longevity. Recently, crossbreeding
gained great attention because it may help to overcome most of these problems, in fact it bring
about new combinations of additive genetic components, expression of heterosis, more
economical efficiency and a better strength of crossbred animals compared with the parental
breeds (Van Raden, 2003, Sorensen et al., 2008).
Crossbreeding of pure Holstein (H) with other breeds is a useful strategy to improve
functional e productive traits of animals; Heins et al., (2006) reported that Scandinavian Red
(S) and Montbeliarde (M) sires induced a fat plus protein daily production amounts 2.2 and
3.8% lower than purebred H, but survival to 150 d in the first lactation was 5% higher
compared with pure H, and also calving difficulty and stillbirth rates were significantly
reduced (Heins et al., 2006, Heins et al., 2012).
Several studies considered pure breeds employed in crossbreeding schemes for
functional traits, like conception rate, days open, and productive life, and for productive traits
such as milk yield, fat, protein, and somatic cell score (Bryant et al., 2007; Prendiville et al.,
2010; Heins et al., 2012) but knowledge on the effect of crossbreeding on content, proportion
(and daily yield) of milk protein fractions is very scarce.
The aim of this work were to analyze the milk protein fractions content, proportion
(and daily yield) of individual milk samples of purebred Holsteins, of two-way crossbred
cows with B (B×H), M (M×H) and S (S×H) bulls and of three-way crossbred cows with the
same breeds [M× (B×H); M×(S×H); and S×(M×H)] and of estimating the effects of herd/test
day, parity, stage of lactation and breed combination on these traits.
MATHERIALS AND METHODS
Animals and milk sampling
Individual milk samples of purebred H cows (n = 159), and of crossbred cows reared
in three herds located in the north of Italy, were collected from January to February 2013. The
herds were following a common crossbreeding scheme starting from purebred H cows. The
basic scheme was a three-breed rotational based on the use of Swedish Red (S) semen on H
cows (S×H), Montbeliarde (M) semen on S×H cows [M×(S×H)], and again H semen on
M×(S×H). In all herds, a smaller proportion of purebred H were mated inverting the breed
order (M×H and S×(M×H)) or using Brown Swiss (B) bulls (B×H), and then M bulls
(M×(B×H)). The crossbreeding scheme is represented in Figure 1 together with the number of
cows sampled for each breed combination.
The sampled cows represented different stages of lactation (6 classes of days in milk;
DIM) and parities (1-4). Milk sampling occurred once per animal, during evening milking.
Management of herds was in accordance with the rules established by EU for producing the
Predicted Designation of Origin (PDO) cheese Parmigiano-Reggiano, and thus had similar
management conditions: silage, pasture and fresh herbage were not allowed, and the rations
(fed as a total mixed diet) were based on dry roughage, concentrates and added water.
Presevative (Bronopol, 0.6:100 v/v, Sigma-Aldrich, St. Louis, MO) was added in eppendorfes
(1.5 ml) the day before sample collection to prevent microbial growth; during samples
collection milk was immediately transferred at -20 C° and after stored at -80 C° in the
Laboratory of the Department of Agronomy, Food, Natural resources, Animals and
Environment (DAFNAE) of the University of Padova (Legnaro, Padova, Italy) since the RPHPLC analysis was performed
Milk quality trait analyses and protein fractions detection by RP-HPLC
Individual milk samples were analyzed for fat, protein, casein contents using a
MilkoScan FT6000 (Foss, Hillerød, Denmark). Somatic cell count values were obtained from
the Fossomatic FC counter (Foss, Hillerød, Denmark) and were then converted to SCS by
means of logarithm transformation (Ali and Shook, 1980).
Contents of αS1-CN, αS2-CN, β-CN, κ-CN, β-LG, α-LA and LF of individual milk
samples were measured using the RP-HPLC method proposed by Maurmayr et al. (2013).
Briefly, the method provides to separate the caseins and whey proteins in one run, and
to quantify content of A and B variants of κ-CN, content of A1, A2, A3, B, I variants of βCN, content of A and B variants of β-LG, and content of α-LA and lactoferrin, even so
ensuring a rapid analysis (less than 20 minutes) and a good resolution of peaks. Single mother
solution of purified proteins of commercial standards were employed to develop specific
calibration curves; standards are a mixture of milk protein genetic variants and for this reason
single calibration equation were set for every genetic variant. The content of different protein
genotypes of each protein fraction were summed to obtain the total content of that fraction.
Since
S1-CN
and
calculated from the
S2-CN
S
are not available as single proteins, the corresponding values were
applying the 4:1 proportion known for cow milk (Bonizzi et al., 2009).
The γ-CN fraction, consisting of proteolytic products of β-CN, was not detectable with the
current method, multiple peaks were visible on the chromatographic run but it was not
possible to detect and quantify certainly. For protein quantification by the current RP-HPLC
method, total casein content (Casein, g/L) was obtained as the sum of glycosilated and
unglycosilated forms of κ-CN, αs-CN, and β-CN content in milk; total whey proteins content
(g/L) was computed as the sum of β-LG, α-LA and Lf content.
Total true protein content (PRT, g/L) was obtained summing up casein and whey
proteins contents. The proportion of protein fractions were expressed as percentage on PRT,
calculating κ-CN, glycosilated and unglycosilated forms of κ-CN, αs1-CN, αs2-CN, β-CN, αLA, β-LG and LF on PRT content.
Statistical analysis
Data were analyzed by the GLM procedure of SAS (SAS Inst. Inc., Cary, NC)
according to the following linear model:
yijklm = μ + HTDi + Parityj + DIMk + Breedl + eijklm
where yijkl is the measure of a trait; µ is the general mean of the model; HTDi is the fixed
effect of herd-test day i (i = 1, ..7), Parityj is the fixed effect of parity j of the cow (j = 1: first
parity, j = 2: second parity, j = 3: third and later parities), DIMk is the fixed effect of DIM
class k (5 classes of 60-d interval, with the exception of the last class, which included samples
collected at DIM 240 days or greater), Breedl is the fixed effect of lth breed combination (l = 1
to 7) and eijklm is a random residual assumed to follow a normal distribution with eijkl ~ N (0,
σe2), where σe2 is the residual variance. Orthogonal contrasts were estimated between LSM of
traits for the effect of DIM: a) linear component; and b) quadratic component, between LSM
of traits for the effect of parity: a) first-parity vs. second- and later-parity cows; and b)
second-parity vs. third- and later-parity cows, and between LSM of traits for the effect of
breed combination: a) the effect of crossbreeding (H vs. all crossbred cows); b) the effect of
generation (first-generation vs. second-generation crosses); c) the effect of S sires in the firstgeneration cross (S×H vs. M×H + B×H); d) the comparison of Alpine breeds sire in the firstgeneration cross (M×H vs. B×H); e) the comparison of S sires and M sires in the secondgeneration cross (S×MH vs. M×SH + M×BH); and f) the effect of maternal grand-sire breed
in second-generation crosses with M sire (M×SH vs. M×BH).
RESULTS AND DISCUSSION
Milk quality traits and protein fractions amount
Descriptive statistics for the investigated traits are reported in Tab.1
The content of milk protein fractions obtained by RP-HPLC showed differences between the
protein content assessed in the national milk recording program.
This could be probably explained because different methodologies and kind of analysis give
often different results ; in literature milk proteins has been widely studied considering many
investigation approaches, like liquid chromatography (Bobe et al., 1998; Holland et al., 2010)
isoelectring focusing (Strange et al., 1992) electrophoretic techniques (Veloso et al., 2002)
proteomic approaches (Jensen et al., 2012) and often results are in disagreement; kind of
sample preparation, conservation options and type of technique influence attended
composition and average of the substances, in this case different protein content amount has
to be expected. Moreover protein content detected by RP-HPLC is greater than content and
casein index reported in other studies because the method is not able to provide NPN and
minor components amount, such as BSA and Ig.
On the other hand, sample conditions seem to play an important role; more favorable
conservation of samples after herd collection ensure a good condition of milk for HPLC
analysis than milk collected in the milk recording program (Bonfatti et al., 2010).
Milk protein fraction detection
Two variants were detected for κ-CN: A and B variants; variant E coeluted closely
with variant A. Five variants were detected for β-CN: B, A1, A2, A3 and a fifth variant called
“X” because of its absence in the DNA-genotyped animals pool used for the method
validation; forβ-Lg, 2 variants were identified: A and B variants; in our population,
concerning αS1-CN, the two variants B and C seem to be fixed in the population.
No polymorphism was detected for α-LA; several studies confirmed the presence of
genetic variants for this kind of whey protein (Farrell et al., 2004), but in our study any animal
carried alleles. No variability was observed for Lf, although further investigations are required
for this kind of protein, because of their absence in literature.
Concerning β-Lg, it is important to note that it is associated with κ-CN; particularly, the two
genotypes are not linked because they are on separate chromosomes in cattle, but different
alleles combinations carry out differences in milk protein composition; especially, the A
variant of β-LG increases the proportion of κ-CN and generally has a favorable effect on
protein yield (in agreement with Bobe et al., 1999); moreover breeds like pure Holstein have a
higher frequency of A allele of κ-CN, and this variant gives a lower content of total casein; on
the other hand, the B variant of β-LG increased the proportion of BLG and fat content in total
milk (Tsiaras et al., 2005).
Herd test day effect
Estimated effect of herd test day, Dim and parity on milk protein fractions (g/L) are reported
in Tab. 3. As expected, HTD was highly significant for every single protein fractions.
Days in milk and Parity effects
All protein fractions, except κ-CN and αS2-CN, seem to be influenced by lactation stage; in
fact, at the begin of lactation, the amount of proteins in milk is low, probably because body
weight of cows tend to decrease in the first period (90 d), such as protein and fat; this because
the body energy changes through lactation, and it have to be noted that the greatest energy
mobilization occurred in the first 2 wk of lactation (Koenen et al., 2001; Friggens et al.,
2007).
In the second phase, after the peak of lactation and just until the dry period, milk
production starts to decrease, but at the same time fat, protein and body weight increase, as
result of the energy balance change (Pirlo et al., 2000; Heins et al., 2006).
Protein fractions have the same trend; this is not true for κ-CN and αS2-CN, because
both seem to follow more closely the trend of the lactation curve; other works confirm that
these two protein fractions are strictly associated because the B variant of κ-CN is associate
with a greater relative concentration of αS2-CN and total κ-CN (Heck et al., 2009). Results
obtained for protein composition are different, in fact significance has been observed just for
caseins and Lf; the 4 casein genes are closely linked and organized in a casein locus located in
bovine chromosome 6; this can partially explain the relation existing between the casein
fractions on milk protein composition, but it is difficult to determine whether the effect of a
casein variant is specific to another casein fraction or is maybe an effect of another casein
gene, close linked.
Considering parity effect, F and P values for casein fractions are statistically
significant, but nor for whey protein fractions and total whey; Reported results in the literature
are contradictory; Joudu et al., (2008) found that parity effect on milk protein content was
significant on β-LG. Contradictions may have arisen from differences in experimental design,
technique employed for milk analysis, number of animals, feeding conditions. In our study
casein fractions showed a decrease depending on the parity level; this is in accordance with
other studies, as lactation’s number influences milk protein content. Pluriparous animals
attend a higher milk production, but milk quality get worse, because protein average decreases
(Hansen et al., 2006). Results obtained for protein composition (%) are different; significance
was observed just for κ-CN, β-CN and β-LG content.
Breed effect
Results for milk protein fractions tested by crossbred effect are shown in Tab. 3.
P values were significant (P<0.05) for κ-CN, α-LA and BLG; B variant of κ-CN is associated
with a lower relative concentration of α-LA; our results are in agreement with other studies
(Heck et al., 2009), but other studies reported no effect on this kind of whey protein (Bobe et
al., 1999). As explained before, protein composition changes considering different genotype
combinations; animals selected for B variant of κ-CN carry out a more appreciable quality of
milk, because B variant increases the total casein content; this is associated with a lower
concentration of other proteins, such as α-LA and αS1-CN.
On the other hand, breeds like pure Holstein, which is not selected for these traits,
have different proportions of casein and whey proteins, because κ-CN content is lower and
consequently average of other proteins, like β-LG and α-LA is higher (Demeter et al., 2010).
Results obtained for protein composition (%) are similar, with a statistical difference for TCN
and WH too; genetic variants of protein fractions are associated with the protein composition
of milk (Heck et al., 2009).
Contrasts for parity, Dim and breed
Contrasts were tested to analyze statistical differences of parity, DIM and crossbred
combinations on milk protein fractions. Results of contrasts are reposted in Tab. 5.
Differences for the first trype of contrast were significant for all casein and whey protein
fractions, except Lf.
Concerning the second type of contrast, just κ-CN showed significant differences (P< 0.05).
Linear and quadratic contrasts were applied to analyze differences of DIM. Linear contrast
were significant for all protein fractions (g/L), except κ-CN and α-LA, and for protein
composition (%), except β-CN. Quadratic contrasts were significant just for κ-CN and lf.
As reported by other works, κ-CN genotype affects milk yield and milk protein composition
(Ng-Kwai-Hang et al., 1984); in our study, κ-CN showed a similar trend to those of lactation
curve; this is not in agreement with other studies, where αS and κ-CN decreased during
lactation, while β-CN increased (Ostersen et al., 1997); contradictions may be explained by
the conservation status of milk and health level of cows; proteolysis in milk is very moderate
in high producers animals, but especially high in very low yielding cows; probably κ-CN is
more resistant to natural proteolysis and generally the nutritional state of animals influence
proteolytic activity.
Lf has a similar behavior, such as κ-CN; in literature just a few investigations focused on Lf
and its physiological role in dairy cows; results in our study suggested first of all that
distribution of Lf is slightly asymmentrical (Leclerq et al., 2009). Moreover our results are in
agreement with other studies where a significant correlation between Lf concentration in milk
and stage of lactation, fat and protein percentage and SCS was found (Krol et al., 2013; cheng
et al., 2009; Arnould et al., 2009), this may suggest that Lf content could be potentially used
as mastitis indicator (Harmon et al., 1976).
Contrasts for crossbred combinations are shown in Tab. 6.
Purebred vs crossbred contrast were significant for κ-CN (P<0.01), LA (P<0.05), Lg
(P<0.01), total casein (P<0.05) and total whey (P< 0.05). Concerning different crossbred
combinations, just Sx(MxH) vs Mx(SxH)+Mx(BxH) was significant for Lg (P<0.05), casein
(P< 0.05) and whey (P<0.05).
Selective breeding can change milk protein composition to improve milk quality and milk
coagulation properties; consequently purebreds like Holstein and Brown Swiss has been
widely selected for some traits, like milk production and B variant of κ-CN, respectively.
Several studies focused on the relationship between protein composition, milk production and
milk protein variants (Demeter et al., 2010; Ojala et al., 1997; Bobe et al., 1999; Heck et al.,
2009). Cheese yield increases because of casein concentration and cheese making properties
like milk coagulation time and curd firmness depend on casein composition (Wedholm et al.,
2009; Robitaille et al., 2002).
Moreover in some breeds, like pure Holstein, A and B variants of β-LG and A1 and A2
variants of β-CN occur frequently (Boettcher et al., 2004). A2 variant of β-CN is also
associated with higher protein yield (Heck et al., 2009).
Because casein loci are closely linked on bovine chromosome 6, alleles of the different casein
are in linkage disequilibrium; moreover, because of this, aggregate casein genotypes should
be considered when estimating genotypes effects (Hallen et al., 2008).
In this study, purebreds like pure Holstein and Brown Swiss present different protein fractions
amount, above all for κ-CN, α-LA and β-LG. Pure Holstein, not selected for B variant of κCN, has higher frequency of AB and AA genotypes for κ-CN; this combination affects whey
composition of milk, because A variant of κ-CN is correlated to a lower amount of α-LA;
high A variant frequency for β-LG is strongly associated with a greater relative concentration
of β-LG and a lesser concentration of the other protein fractions; our results are in accordance
with other investigations (Mclean et al., 1984; Ng-Kwai-Hang et al., 1986; Lunden et al.,
1996; Huang et al., 2012).
Concerning F1 and F2 generations, contrasts were significant just for α-LA; the protein
amount is higher in the F2 generation than in F1 generation. This could be explained partially
by the different genotypes combinations in crossbred cows and by the additive genetic effect.
Differenced between Sx(MxH) vs Mx(sxH) and Mx(BxH) combinations are
significant for β-LG (P<0.05), casein (P<0.05) and whey (P< 0.05). A partial explanation of
differences between these crossbreeds may be given by the cross-scheme itself; crossbreeding
interest has been growed for its potential role in dairy industry, to improve functional and
productive traits of animals; several studies reported the heterosis contribution on important
traits like milk production, protein and fat percentage (McAllister et al., 1994; McAllister,
2002; Fohrman et al., 1954). Moreover Montbeliarde has naturally high frequency of b variant
of κ-CN (Ikonen et al., 1999); our results suggest that genotypes interactions and
crosscombinations between Montbeliarde and Brown Swiss and Holstein influence milk
composition, above all whey.
CONCLUSIONS
In conclusion, we herein described a RP-HPLC method able to identify and quantify
the most common protein fractions amount of individual milk of different crossbred
combinations. This method guarantee a good resolution of peaks, genotypes of animals,
content of milk proteins and genetic variants too.
The possibility to analyze the complete milk protein profile just in one
chromatographic run gave us a very detailed evaluation of milk characteristics and milk
quality traits, such as genotypes and amount of milk protein and genetic variants. Protein
composition determines the nutritional value and the technological properties of milk and this
indicates that selection for specific variants can be a useful tool in selecting for animals with a
desired protein composition.
Our results show that protein fractions and protein composition vary by stage of
lactation, general health of the animals and number of lactations, although both traits show
different significativity; important factors like cheese yield and cheese properties increases
with casein concentration and casein composition; casein and whey amount itself increases or
decreases depending on the protein variants attended or not in milk, because a relation exist
among their, above all κ-CN seem to be close related to αS-CN, α-LA and β-LG content.
Crossbred combination and generally crossbreeding can be a very useful strategy to
improve animal selection, to keep breeds with more appreciable genetic richness, depending
on the intended use of milk. Productivity of pure Holstein could be kept if coupled with
Alpine European breeds, especially Montbeliarde and Brown Swiss.
Finally, our study showed the relevance of crossbreeding and the importance to
improve analytical methodologies to find and better understand the relationship existing
among milk protein fractions, composition and genetic variants association on milk quality
and cheese making properties.
ACKNOWLEDGEMENTS
The authors wish to thank the managers of the three dairy farms for their collaboration
and the technical support of the Lucio Toniolo Experimental Farm (University of Padova)
REFERENCES
Arnould V. M.-R., H. Soyeurt, N. Gengler, F. G. Colinet, M. V. Georges, C. Bertozzi, D.
Portetelle, and R. Renaville. 2009. Genetic analysis of lactoferrin content in bovine
milk. J. Dairy Sci. 92:2151-2158.
Bittante, G., M. Penasa, and A. Cecchinato. 2012. Invited review: Genetics and modeling of
milk coagulation properties. J. Dairy Sci. 95:6843-6870.
Bobe, G., D. C. Beitz, A. E. Freeman, and G. L. Lindberg. 1998. Separation and
quantification of bovine milk proteins by reversed phase high performance liquid
chromatography. J. Agric. Food Chem. 46:458-463.
Bobe G., D. C. Beitz, A. E. Freeman, and G. L. Lindberg. 1999. Effect of milk protein
genotypes on milk protein composition and its genetic parameters estimates. J. Dairy.
Sci. 82:2797-2804.
Bobe G., A. E. G. Freeman, G. L. Lindberg, and D. C. Beitz. 2004. Milk protein genotypes
explain variation of milk protein composition. Anim. Ind. Report ASL R1901.
Boettcher P. J., A. Caroli, A. Stella, S. Chessa, E. Budelli, F. Canavesi, S. Ghiroldi, and G.
Pagnacco. 2004. Effects of casein haplotypes on milk production traits in italian
Holstein and Brown Swiss Cattle. J. Dairy Sci. 87:4311-4317.
Bonfatti V., G. Di Martino, A. Cecchinato, D. Vicario, and P. Carnier. 2010. Effects of β-κcasein (CSN2-CSN3) haplotypes and β-lactoglobulin (BLG) genotypes on milk
production traits and detailed protein composition of individual milk of Simmental
cows. J. Dairy Sci. 93:3797-3808.
Bonizzi I., J. N. Buffoni, and M. Feligini. 2009. Quantification of bovine casein fractions by
direct chromatographic analysis of milk. Approaching the application to a real
production context. J. Chromatogr. A. 1216:165-168.
Bryant J. R., N. Lopez-Villalobos, J. E. Pryce, C. W. Holmes, D. L. Johnson, and D. J.
Garrick. 2007. Short communication: effect of environment on the expression of breed
and heterosis effects for production traits. J. Dairy Sci. 90:1548-1553.
Cecchinato, A., M. Penasa, M. De Marchi, L. Gallo, G. Bittante, and P. Carnier. 2011.
Genetic parameters of coagulation properties, milk yield, quality, and acidity
estimated using coagulating and noncoagulating milk information in Brown Swiss and
Holstein-Friesian cows. J Dairy Sci. 94:4214-4219.
Cheng J. B., J. Q. Wang, D. P. Bu, G. L. Liu, C. G. Zhang, H. Y. Wei, L. Y. Zhou, and J. Z.
Wang. Factors affectiong the lactoferrin concentration in bovine milk. J. Dairy Sci.
91:970-976.
Dechow C. D., G. W. Rogers, J. B. Cooper, M. I. Phelps, and A. L. Mosholder. 2007. Milk,
fat, protein, somatic cell score, and days open among Holstein, Brown Swiss, and their
crosses. J. Dairy Sci. 90:3542-3549.
Demeter, R. M., K. Markiewicz, J. A. M. Arendonk, and H. Bovenhuis. 2010. Relationship
between milk protein composition, milk protein variants, and cow fertility traits in
Duch Holstein-Friesian cattle. J. Dairy Sci. 93:5495-5502.
Farrell H. M., Jr., R. Jimenez-Flores, G. T. Bleck, E. M. Brown, J. E. Butler, L. K. Creamer,
C. L. Hicks, C. M. Hollar, K. F. Ng-Kwai-Hang, and H. E. Swaisgood. 2004.
Nomenclature of the proteins of cows’ milk-sixth revision. J. Dairy Sci. 87:1641-1674.
Fohrman, R. H., R. E. McDowell, C. A. Matthews, and R. A. Hilder. 1954. A crossbreeding
experiment with dairy cattle. Tech Bull, 1074. USDA, Washington, DC.
Friggens N. C., P. Berg, P. Theilgaard, I. R. Korsgaard, K. L. INgvartsen, P. Løvendahl, and
J. Jensen. 2007. Breed and parity effects on energy balance profiles through lactation:
evidence of genetically driven body energy change. J. Dairy Sci. 90:5291-5305.
Gallo L., P. Carnier, M. Cassandro, R. Mantovani, l. Bailoni, B. Contiero, and G. Bittante.
1996. Change in body condition score of Holstein cows affected by parity and mature
equivalent milk yield. J.. Dairy Sci. 79:1009-1015.
Hallèn E., A. Wedholm, A. Andrèn, and A. Lundèn. 2007. Effect of β-casein, κ-casein and βlactoglobulin genotypes on concentration of milk protein variants. J. Anim. Breed.
Genet. 125:119-129.
Hansen, J. V., N. C. Friggens, and S. Højsgaard. 2006. The influence of breed and parity on
milk yield, and milk yield acceleration curves. Livest. Sci. 104:53-62.
Harmon, R. J., F. L. Schanbacher, L. C. Ferguson, and K. L. Smith. 1976. Changes in
lactoferrin, immunoglobulin G, bovine serum albumin, and α-lactalbumin during acute
experimental and natural coliforms mastitis in cows. Infect. Immun. 13:533-542.
Heck, J. M. L., A. Schennink, H. J. F. van Valenberg, H. Bovenhuis, M. H. P. W. Visker, J.
A. M. van Arendonk, and A. C. M. van Hooijdonk. 2009. Effects of milk protein
variants on the protein composition of bovine milk. J. Dairy Sci. 92:1192-1202.
Heins B. J., L. B. Hansen, and A. J. Seykora. 2006. Production of pure Holstein versus
crossbreds of Holstein with Normande, Monbeliarde, and Scandinavian Red. 2006. J.
Dairy Sci. 89:2799-2804.
Heins B. J., L. B. Hansen, A. J. Seykora, D. G. Johnson, J. G. Linn, J. E. Romano, and A. R.
Hazel. 2008. Crossbreds of Jersey x Holstein compared with pure Holsteins for
production, fertility, and body and udder measurements during first lactation. J. Dairy
Sci. 91:1270-1278.
Heins B. J., and L. B. Hansen. 2012. Short communication: fertility, somatic cell score, and
production of Normande x Holstein, Montbèliarde x Holstein, and Scandinavian Red x
Holstein crossbreds versus pure Holsteins during their first 5 lactations. J. Dairy Sci.
95:918-924.
Holland B., S. Rahimi Yadzi, G. Ion Titapiccolo, and M. Corredig. 2010. Short
communication: separation and quantification of caseins and casein macropeptides
using ion-exchange chromatography. J. Dairy Sci. 93:893-900.
Holt, C., J. A. Carver, H. Ecroyd and D. C. Thorn. 2013. Invited review: Ceseins and the
casein micelle: Their biological functions, structures, and behavior in foods. J Dairy
Sci. 96:1-20.
Huang W., F. Peñagaricano, K. R. Ahmad, J. A. Lucey, K. A. Weigel, and H. Khatib. 2012.
Association between milk protein gene variants and protein composition traits in dairy
cattle.
Ikonen T., K. Ahlfors, R. Kempe, M. Ojala, and O. Ruottinen. 1998. Genetic parameters the
milk coagulation properties and prevalence of noncoagulating milk in finnish dairy
cows. J. Dairy. Sci. 82:205-214.
Jensen, H. B., J. W. Holland, N. A. Poulsen, and l. B. Larsen. 2012. Milk protein genetic
variants and isoforms identified in bovine milk representing extremes in coagulation
properties. J. Dairy Sci. 95:2891-2903.
Jōudu I., M. Henno, T. Kaart, T. Püssa, and O. Kärt. 2008. The effect of milk protein
contents on the rennet coagulation properties of milk from individual dairy cows. Int.
Dairy J. 18:964-967.
Koenen, E. P. C., R. F. Veerkamp, P. Dobbelaar, and G. De jong. 2001. Genetic analysis of
body condition score of lactating dutch Holstein and red-and-white heifers. J. Dairy
Sci. 84:1265-1270.
Król J., A. Brodziak, Z. Litwińczuk, and A. Litwińczuk. 2013. Effect of age and stage of
lactation on whey protein content in milk of cows of different breeds. Pol. J. Vet. Sci.
16:395-397.
Leclercq, G., N. Gengler, H. Soyeurt, C. Bastin. 2013. Genetic variability of the mid-infrared
prediction of lactoferrin content in milk for Walloon Holstein first-parity cows. Livest.
Sci. 151:158-162.
Lopez-Villalobos N., D. J. Garrick, C. W. Holmes, H. T. Blair, and R. J. Spelman. 2000.
Effects of selection and crossbreeding strategies on industry profit in the New Zealand
dairy industry. J. Dairy Sci. 83:164-172.
Lundèn A., M. Nilsson, and L. Janson. 1997. Marked effect of β-lactoglobulin polymorphism
on the ratio of casein to total protein in milk. J. Dairy Sci. 80:2996-3005.
Martin, B., D. Pomies, P. Pradel, I. Verdier-Metz, and B. Remond. 2009. Yield and sensory
properties of cheese made with milk from Holstein or Montbeliarde cows milked twice
or once daily. J. Dairy Sci. 92:4730-4737.
Maurmayr A., A. Checchinato, L. Grigoletto, and G. Bittante. 2013. Detection and
quantification of αS1-, αS2-, β-, κ-casein, α-Lactalbumin, β-lactoglobulin and
lactoferrin in bovine milk by reverse-phase high-performance liquid chromatography.
Agric. Conspec. Sci.. 78:201-205.
Mayer H. K. 2005. Milk species identification in cheese varieties using electrophoretic,
chromatographic and PCR techniques. Int. Dairy J. 15:995-604.
McAllister, A. J., A. J. Lee, T. R. Batra, and C. Y. Lin. 1994. The influence of additive and
nonaddictive gene action on lifetime yields and profitability of dairy cattle. J. Dairy
Sci. 77:2400-2414.
McAllister, A. J. 2002. Is crossbreeding the answer to questions of dairy breed utilization?. J.
Dairy Sci. 85:2352-2357.
Mclean D. M., E. R. Graham, R. W. Ponzoni, and H. A. McKenzie.1984. Effects of milk
protein genetic variants on milk yield and composition. J. Dairy Res. 51:531-546.
Ng-Kwai-Hang K. F., J. F. Hayes, J. E. Moxley, and H. G. Monardes. 1984. Association of
genetic variants of casein and milk serum proteins with milk, fat, and protein
production by dairy cattle. J. Dairy Sci. 67:835-840.
Ng-Kwai-Hang, K. F., J. F. Hayes, J. E. Moxley, and H. G. Monardes. 1986. Relationships
between milk protein polymorphisms and major milk constituents in Holstein-Friesian
cows. J. Dairy Sci. 69:22-26.
Ojala M., R. T. Famula, and J. F. Medrano. 1997. Effects of milk protein genotypes on the
variation for milk production traits of Holstein and Jersey cows in California. J. Dairy
Sci. 80:1776-1996.
Ostersen S., J. Foldager, and J. E. Hermansen. 1997. Effects of stage of lactation, milk protein
genotype and body condition at calving on protein composition and renneting
properties of bovine milk. J. Dairy Res. 64:207-219.
Pirlo G., F. Miglior, and M. Speroni. 2000. Effect of age at first calving on production traits
ond on difference between milk yield returns and rearing costs in italian Holstein. J
Dairy Sci. 83:603-608.
Prendiville R., K. M. Pierce, and F. Buckley. 2010. A comparison between Holstein-Friesian
and Jersey dairy cows and their F1 cross with regard to milk yield, somatic cell score,
mastitis, and milking characteristics under grazing conditions. J. Dairy Sci. 93:27412750.
Robitaille, G., M. Britten, J. Morisset, and D. Petitclerc. 2002. Quantitative analysis of βlactoglobulin A and B genetic variants in milk of cows β-lactoglobulin AB throughout
lactation. J. Dairy Res. 69:651-654.
Sørensen, M. K., E. Norberg, J. Pedersen, and L. G. Christensen. 2008. Invited review:
crossbreeding in dairy cattle: a Danish perpective. J Dairy Sci. 91:4116-4128.
Strange, E. D., Malin E: L., Van Hekken D. L., Basch J. J. (1992). Chromatographic and
electrophoretic methods used for analysis of milk proteins. J Chromatogr A 624: 81102.
Summer, A., P. Franceschi, A. Bollini, P. Formaggioni, F. Tosi, and P. Mariani. 2003.
Seasonal variations of milk characteristics and cheesemaking losses on the
manifacture of Parmigiano-Reggiano cheese. Vet. Res. Commun. 27(Suppl.1):663666.
Tsiaras, A. M., G. G. Bargouli, G. Banos, and C. M. Boscos. 2005. Effect of Kappa-Casein
and Beta-Lactoglobulin loci on milk production traits and reproductive performance of
Holstein cows. J. Dairy Sci. 88:327-334
VanRaden P. M., and A. H. Sanders. 2003. Economoic merit of crossbred and purebred US
dairy cattle. J. Dairy Sci. 86:1036-1044.
Veloso A. C. A., Teixeira N., Ferreira I. M. P. L. V.O. (2002). Separation and quantification
of
the
major
casein
fractions
by
reverse-phase
high-performance
liquid
chromatography and urea-polyacrylamide gel electrophoresis Detection of milk
adulterations. J Chromatogr A. 967:209-218.
Wedholm A., L. B. Larsen, H. Lindmark-Månsson, A. H. Karlsson, and A Andrèn. 2006.
Effect of protein composition on the cheese making properties of milk from individual
dairy cows. J. Dairy Sci. 89:3296-3305.
Table 1. Descriptive statistics for protein composition and milk quality traits of individual
samples of purebred and crossbred cows (n = 505)1
Trait2
P11
P99
4.83
24.32
46.73
83.10
2.96
89.89
70.33
g/L
4.49
0.84
2.52
6.62
%
10.65
1.52
6.94
14.07
g/L
3.42
0.81
1.96
5.49
%
8.06
1.40
5.13
11.54
g/L
11.64
1.55
8.00
15.39
%
27.60
1.91
22.81
32.00
g/L
13.09
2.14
7.15
17.36
%
30.94
2.91
20.67
36.93
g/L
7.10
1.35
4.24
10.02
%
16.90
2.97
29.67
10.11
g/L
0.11
0.06
0.03
0.27
%
0.26
0.14
0.07
0.63
g/L
1.01
0.21
0.39
1.45
%
2.40
0.45
1.15
3.36
g/L
5.97
1.28
3.37
8.90
%
14.22
2.93
8.45
23.06
fat
%
4.09
0.86
2.09
6.36
protein
%
3.71
0.30
2.94
4.41
units
2.56
1.84
-0.47
7.43
kg/d
31.82
9.95
11.78
55.20
Caseins ,
κ-CN
α-S2-CN
α-S1-CN
β-CN
Whey proteins
Lf
α-LA
β-Lg
Mean
SD
g/L
35.13
%
Milk quality traits
SCS
Milk yield
1
2
P1 = first percentile; P99 = 99th percentile.
Contents of all protein fractions were measured by reversed-phase HPLC on skim milk. TCN
= total casein content = sum of total casein fraction; WH = whey protein = sum of total whey
fraction
Table 2. Results from ANOVA (F-value and significance) for milk protein fraction (g/L) and
proportions (%)
HTD
DIM
Parity
Breed
RMSE1
R2
g/L
11.94***
17.16***
17.50***
1.24
4.14
0.29
%
13.97***
1.26
4.12*
2.74*
2.69
0.20
g/L
8.69***
2.09
18.18***
2.71*
0.76
0.20
%
9.91***
12.69***
8.23***
3.72**
1.34
0.24
g/L
8.76***
1.35
7.63***
0.96
0.76
0.15
Trait
Caseins
κ-CN
α-S2-CN
α-S1-CN
β-CN
Whey proteins
Lf
α-LA
β-Lg
%
6.15***
2.69*
1.00
1.51
1.35
0.10
g/L
19.62***
7.83***
12.50***
1.49
1.34
0.27
%
19.98***
11.56***
0.24
0.71
1.65
0.27
g/L
6.34***
13.86***
21.32***
1.32
1.89
0.24
%
4.57***
0.30
8.04***
1.25
2.80
0.10
g/L
8.55***
15.05***
0.79
1.89
1.21
0.22
%
13.97***
1.26
4.12*
2.74*
2.69
0.20
g/L
5.75***
8.91***
1.16
0.93
0.06
0.14
%
4.00***
4.66**
0.10
1.05
0.14
0.09
g/L
22.12***
3.33*
2.96
3.07**
0.18
0.27
%
12.06***
1.74
0.97
2.63*
0.42
0.17
g/L
8.27***
13.87***
0.51
2.54*
1.15
0.22
%
15.32***
1.72
3.92*
3.32**
2.62
0.22
1
RMSE = Root means square error; 2TCN= total casein content = sum of total casein fraction;
3
WH = whey protein = sum of total whey fraction;
† P <0.10; * P < 0.05; ** P < 0.01; *** P < 0.001.
Table 3: Least squares means of milk protein fraction and milk protein composition across parities
Item
Caseins
1
g/L
37.07
%
83.76
κ-CN
g/L
4.85
%
10.98
α-S2-CN
g/L
3.67
%
8.26
αS1-CN
g/L
12.12
%
27.45
β-CN
g/L
13.94
%
31.51
Whey proteins
g/L
7.17
%
16.24
Lf
g/L
0.12
%
0.27
α-LA
g/L
1.05
%
2.38
β-Lg
g/L
6.01
%
13.59
P < 0.05; ** P < 0.01; *** P < 0.001.
Parity
2
34.95
82.99
4.35
10.35
3.41
8.06
11.52
27.44
12.83
30.47
7.1
17.01
0.11
0.26
1.00
2.4
5.99
14.35
≥3
33.95
82.84
4.36
10.7
3.29
8.03
11.27
27.57
12.37
30.11
6.97
17.15
0.11
0.26
1.00
2.45
5.87
14.44
Contrast, P values
P1 vs P2+≥P3
P2 vs ≥P3
***
ns
**
ns
***
ns
**
*
***
ns
ns
ns
***
ns
ns
ns
***
ns
***
ns
ns
ns
**
ns
ns
ns
ns
ns
*
ns
ns
ns
ns
ns
**
ns
Table 4: Least squares means of milk protein fraction and milk protein composition across days in milk (DIM)
Item
<60 d
Caseins
g/L
33.00
%
83.42
κ-CN
g/L
4.41
%
11.1
α-S2-CN
g/L
3.36
%
8.45
αS1-CN
g/L
11.18
%
28.33
β-CN
g/L
12.09
%
30.58
Whey proteins
g/L
6.53
%
16.58
Lf
g/L
0.09
%
0.22
α-LA
g/L
0.97
%
2.44
β-Lg
g/L
5.47
%
13.92
P < 0.05; ** P < 0.01; *** P < 0.001.
60-120 d
33.90
83.40
4.51
11.09
3.37
8.24
11.27
27.79
12.46
30.61
6.70
16.60
0.10
0.25
1.01
2.48
5.59
13.87
DIM
121-18 0d
35.92
83.34
4.67
10.85
3.48
8.02
11.81
27.43
13.36
30.96
7.09
16.66
0.13
0.29
1.03
2.39
5.93
13.97
181-240 d
36.69
83.20
4.61
10.48
3.55
8.00
11.93
27.06
13.56
30.71
7.33
16.80
0.13
0.30
1.06
2.43
6.14
14.08
>240 d
37.13
82.62
4.42
9.86
3.56
7.87
12.03
26.82
13.79
30.62
7.79
17.38
0.12
0.26
1.04
2.33
6.64
14.80
linear
***
*
ns
***
*
**
***
***
***
ns
***
*
***
*
**
ns
***
*
Contrast
quadratic
ns
ns
**
*
ns
ns
ns
ns
ns
ns
ns
ns
***
**
ns
ns
ns
ns
Table 5. Least squares means of milk protein fraction and milk protein composition across breed combinations
Item
Caseins
Purebreds:
H×H
F1 crossbreds:
S×H M×H B×H
g/L
34.79
35.88
%
82.53
82.98
κ-CN
g/L
4.30
4.53
%
10.22
10.48
αS2-CN
g/L
3.35
3.41
%
7.90
7.88
αS1-CN
g/L
11.54
11.93
%
27.46
27.65
β-CN
g/L
13.10
13.49
%
31.07
31.17
Whey proteins g/L
7.31
7.33
%
17.46
17.01
Lf
g/L
0.12
0.12
%
0.29
0.26
α-LA
g/L
0.98
1.02
%
2.32
2.36
β-Lg
g/L
6.22
6.20
%
14.84
14.38
P < 0.05; ** P < 0.01; *** P < 0.001.
35.87
83.84
4.68
10.95
3.68
8.52
11.71
27.48
13.04
30.48
6.89
16.15
0.11
0.26
1.00
2.33
5.78
13.54
34.89
82.65
4.56
10.82
3.45
8.07
11.55
27.49
12.67
29.99
7.25
17.34
0.10
0.22
0.97
2.32
6.18
14.79
F2 crossbreds:
S×
M×
M×
(M×H) (S×H) (B×H)
36.11
84.50
4.72
11.10
3.42
7.99
11.89
27.86
13.44
31.39
6.58
15.49
0.12
0.28
1.08
2.53
5.38
12.68
35.33
83.29
4.57
10.84
3.47
8.14
11.62
27.42
13.03
30.63
7.04
16.70
0.11
0.25
1.07
2.53
5.86
13.91
34.43
82.52
4.30
10.29
3.46
8.28
11.25
27.00
12.58
30.11
7.22
17.47
0.11
0.26
1.02
2.48
6.09
14.71
Purebreds F1 vs F2
vs
crossbreds
Crossbreds
ns
ns
*
ns
**
ns
*
ns
ns
ns
ns
ns
ns
ns
ns
ns
ns
ns
ns
ns
ns
ns
*
ns
ns
ns
ns
ns
*
ns
*
*
*
ns
**
ns
Contrasts:
S×H vs B×H
[M×H +
vs
B×H]
M×H
ns
ns
ns
ns
ns
ns
ns
ns
ns
ns
ns
ns
ns
ns
ns
ns
ns
ns
ns
ns
ns
ns
ns
ns
ns
ns
ns
ns
ns
ns
ns
ns
ns
ns
ns
ns
S×(M×H) vs
[M×(S×H)+
M×(B×H)]
ns
*
ns
ns
ns
ns
ns
ns
ns
ns
ns
*
ns
ns
ns
ns
*
*
M×(S×H)
vs
M×(B×H)
ns
ns
ns
ns
ns
ns
ns
ns
ns
ns
ns
ns
ns
ns
ns
ns
ns
ns
Figure 1. Crossbreeding scheme and, within brackets, number of cows sampled for milk quality,
coagulation traits and individual curd firmness modeling analyses (H: Holstein; M: Montbeliarde;
S: Swedish Red; B: Brown Swiss).
Purebred:
H×H (159)
First cross:
M×H (42)
S×H (140)
B×H (17)
Second cross:
S×MH (20)
M×SH (140)
M×BH (26)
CHAPTER 3
Effect of breed and dairy system on cow’s milk protein fraction and
composition
Alice MAURMAYR
Department of Agronomy, Food, Natural Resources, Animals and Environment
Viale dell’Università 16, 35020 Legnaro (PD), Italy
Effect of breed and dairy system on cow’s milk protein fraction and composition
Maurmayr A.
Department of Agronomy, Food, Natural Resources, Animals and Environment
Viale dell’Università 16, 35020 Legnaro (PD), Italy
ABSTRACT
The aim of this study was to investigate the effect of some environmental source of variation and of
different dairy systems on the proportion and amount of the most common milk protein fractions,
included some minor components like lactoferrin. A total of 783 individual milk samples were
collected during evening milking in 26 dairy herds located northern Italy, in the Trento Province.
For every farm two breeds were attended at least; six breeds were employed, three high-production
and three dual-purpose: Holstein-Friesian, Brown Swiss, Jersey and Gray Alpine, Simmental and
Rendena, respectively. Four types of dairy herd were considered in this study: modern herd type,
traditional herd type with silage use, traditional herd type without grazing use and traditional
original herd type. Milk samples were analyzed by reverse-phase high performance liquid
chromatography and protein fractions amount (g/L) and proportion (% of total true protein) were
obtained. Traits were analyzed by using a linear mixed model including the fixed effects of herdtest-day, herd type, herd-test-day within herd type, parity, days in milk, breed and milk yield. The
traits considered in this work showed generally normal distribution, with the exception of
lactoferrin which showed an asymmetrical distribution.
Within herd type affected all the tested milk protein traits; Parity was a major source of variation for
all studied traits, particularly for casein content. κ-CN, αS1-CN and β-CN, Lf and β-Lg contents,
expressed as g/L, were the most influenced traits concerning stage of lactation, which although
exerted a smaller effect than parity; Milk yield was less important than DIM and parity, but
nevertheless affected most of the studied traits, especially the casein content; concerning breed
effect, Jersey cows showed the highest total casein and whey protein amount, and Holstein-Friesian
attended the worst; in Gray Alpine a new genetic κ-CN variant was detected using our reverse phase
HPLC method, but not identified, so further investigation is required.
Traditional dairy herd type with silage use was the best strategy with the highest milk protein
content, although it showed the highest somatic cell content; modern herd type gave unexpectedly
inferior performances and traditional herd without grazing was instead the worse concerning milk
protein content.
Key words: casein fractions, whey proteins, lactoferrin, multi-breed herd, dairy system
INTRODUCTION
Dairy industry plays a very important role in Italy; more than 70 % of the whole milk
production is delivered to the cheese making industry, and about the 80 % of that is used for typical
italian products, or high-quality cheeses, including Protected Designation of Origin Products, such
as Parmigiano-Reggiano and Grana Padano (Cassandro et al., 2003; De Marchi et al., 2008).
Because of this, dairy milk is strictly associated with quality, because milk required to have great
capacity to coagulate and to develop a good syneresis. Bovine milk is typically made of 87% water,
3,9% fat, 3,25% protein, and 5,5% of other molecules. Concerning milk proteins, Casein is the most
important protein as for quantitative and nutritional aspects. The major proteins belonging to this
group are usually referred to as αs1-, αs2-, β- and κ-fractions (Bonizzi et al., 2009, Farrell et al.,
2004). Whey proteins are described as the group of milk protein that remain soluble in serum or
whey after precipitation of milk casein at pH 4.6; β-Lg, α-LA, serum albumin, Ig, Lf, and proteosepeptone fractions have been considered the major characterized components of this fraction (NgKwai-Hang et al., 2003). κ-casein and β-lactoglobulin showed to have significant effect on milk
protein composition; generally the B allele of κ-casein is associated with a higher CN number,
higher κ-casein concentration, and moreover higher curd firmness. The B variant of β-Lg seems to
be expressed at a lower level, compared with the A variant (Hallen et al., 2007). α-LA interacts to
form the lactose synthase complex; Ig group are attended in colostrums, and give immunity; Lf,
specific iron-binding proteins varies and increases in response to inflammation or infection.
Polymorphism has been observed for all milk proteins and play a key role in the technological
properties and quality of milk. Genotypes of milk proteins, particularly of κ-CN and β-Lg, were
found to affect milk composition.
As strategies employed to improve animal value and to alter yield and composition of milk,
selection and breeding programs were focused for a long time to increase productivity of animals;
as consequence of this, genetic variability decreased and other functional traits, like longevity,
fertility and productive life became worse (Lopez-Villalobos et al., 2000; Van Raden et al., 2003).
Structure of dairy herds changed rapidly in the last decades, with a progressive concentration and
specialization of animals: Holstein were imported from USA into Europe, dairy systems employed
large average herd sizes, use of specialized breeds, and feed diet with high energy density, use of
artificial insemination, but as consequence, management practices and animal health get worse,
because product of daily energy output and duration of lactation increased, with long-term
problems. The relationship existing among milk performances and health showed an unfavorable
genetic correlation between milk yield and incidence of metabolic stress, ketosis, ovarian cyst,
mastitis and lameness, in addition to fertility and longevity reduction and inbreeding depression
(Lopez et al., 2004; Adamec et al., 2006).
Today general attention, especially in Italy, get more on milk quality and consequently on
the protection of local purebreds, strong linked to the environmental preservation, local tradition
and tourism, and historical tradition conservation (Corazzin et al., 2009). Sustainability of livestock
farms system aims to protect and guarantee rural development; this kind of strategy has to consider
farm diversification, such as resources, species and production’s orientation, and some concepts
such as animal welfare, biodiversity, food safety and quality, economic value (Sturaro et al., 2013).
For this reason, in the northern italian mountain areas, milk production is focused on small
farms which use pastures or grazing in summer season, and local breeds, such as Simmental, Alpine
Brown, Rendena, Gray Alpine, characterized by lower milk yield and production, but better
functional traits and general health status. Nevertheless, in some areas like Trento region, herds
tried to get more specialized, replacing Alpine Brown with Brown Swiss and introducing other
breeds like Holstein-Friesian (De Marchi et al., 2007).
Also local breeds are very useful to give information about genetic variability of dairy traits,
environmental interaction, land use and farm management. Several studies focused on the
importance of italian Alpine dairy farms, above all considering milk and cheeses produced during
highland grazing (Pretolani and Raffaelli, 2007; Penati et al., 2011); moreover consumers perceived
differences in the sensory properties of milk and cheeses, such as taste, flavor, texture, because of
the action of substance attended in some types of grass, silage and forages, like α-tocopherol,
carotenoids and terpenes (Leiber et al., 2005; Bovolenta et al., 2009; Kalač et al., 2011).
On the other hand, a few studies focused on milk protein fractions and composition of local
breeds (Bonfatti et al., 2010), but on our knowledge no works are available concerning these kind of
traits in multi-breeds farms. So the aim of this study was to analyze individual raw milk samples of
three specialized purebred cows, Holstein-Friesian, Jersey, and Brown Swiss, and of three local
dual-purpose breeds, Rendena, Simmental and Gray Alpine, reared in multibreeds herds, estimating
effect of herd test day, herd type, stage of lactation, parity, breed and milk yield on milk protein
fractions and milk protein composition.
MATHERIALS AND METHODS
Animals and milk sampling
Individual milk samples of pure Holstein-Friesian (HF, n = 180), Jersey (J, n = 47), Brown
Swiss (BS, n = 269), Rendena (R, n = 103), Simmental (SI, n = 99) and Gray Alpine (GA, n = 75),
reared in 26 herds located in the north of Italy (Trento and Bolzano Province) were collected from
March to July 2013. Milk sampling occurred once per animal, during the evening milking. Herds
considered were classified on the basis of kind of management, defining four different herd dairy
systems: a) Modern (intensive herd with use of unifeed and free stall of animals; b) traditional with
silage (traditional herds with silage supplementation, tied animals and alpine grazing during
summer period); c) traditional no grazing (traditional herds without silage supplementation and
without grazing period, tied animals) and d) traditional original (traditional herds, traditional
feeding without silage, grazing period during summer, tied animals).
Presevative (Bronopol, 0.6:100 v/v, Sigma-Aldrich, St. Louis, MO) was added in
eppendorfes (1.5 ml) the day before sample collection to prevent microbial growth; during samples
collection milk was immediately transferred at -20 C° and after stored at -80 C° in the Laboratory of
the Department of Agronomy, Food, Natural resources, Animals and Environment (DAFNAE) of
the University of Padova (Legnaro, Padova, Italy) since the RP-HPLC analysis was performed.
Individual milk samples were analyzed by RP-HPLC for protein fractions amount and composition;
fat, protein, casein percentages were obtained using a MilkoScan FT6000 (Foss, Hillerød,
Denmark). Somatic cell count values were obtained from the Fossomatic FC counter (Foss,
Hillerød, Denmark) and were then converted to SCS according to the formula proposed by Ali and
Shook (1980): SCS = 3+ log2 (SCC/100,000). Milk pH values were recorded using a Crison Basic
25 electrode (Crison Instruments SA, Barcelona, Spain).
Protein content detection
Contents of αS1-CN, αS2-CN, β-CN, κ-CN, β-LG, α-LA and LF of individual milk samples
were measured using the RP-HPLC method proposed by Maurmayr et al. (2013). Briefly, the
method provides to separate the CN and whey protein fractions in one run, and to quantify content
of A and B variants of κ-CN, content of A1, A2, A3, B, I variants of β-CN, content of A and B
variants of β-LG, and content of α-LA and lactoferrin, even so ensuring a rapid analysis (less than
20 minutes) and a good resolution of peaks.
Single mother solution of purified proteins of commercial standards were employed to develop
specific calibration curves; standards are a mixture of milk protein genetic variants and for this
reason single calibration equation were set for every genetic variant. This method also was able to
identify protein genetic variants and quantify protein fraction content using individual milk
samples. Detailed description of method validation can be found in Maurmayr et al., 2013.
The RP-HPLC method was able to separate enough alleles of αs1-CN fraction, allele B and C
respectively; in the current analysis it was not found an animal carrying
Since
S1-CN
and
calculated from the
S2-CN
S
S1-CN
A or
S1-CN
D.
are not available as single proteins, the corresponding values were
applying the 4:1 proportion known for cow milk (Bonizzi et al., 2009).
Concerning κ-CN, the rare E variant seems to elute very close with A variant, but it was not
possible to discern certainly both variants, because no animal was found in the DNA-genotyped
animal dataset carrying the E variant because of its rarity, so the peak remained unnamed.
The γ-CN fraction, consisting of proteolytic products of β-CN, was not detectable with the
current method, multiple peaks were visible on the chromatographic run but it was not possible to
detect and quantify certainly.
The CN content of samples as a proportion of total protein content in this study was greater
than the casein index reported by other studies because non-protein nitrogen, proteose-peptones and
minor constituents of whey protein cannot be quantified with this method.
Statistical Analysis
Data editing aimed to discard records with sampling or recording errors, such as protein
fractions and protein contents beyond the range of mean ± 3 standard deviation units. At the end of
the editing process, 776 records were employed for the statistical analysis.
Milk protein fractions and relative proportions were analyzed using the MIXED procedure
of SAS (SAS Institute, 2008) with the following linear model:
yijklmno= μ + herd typei + HTD(herd type)i:j+ Parityk + DIMl + breedm + MYn + eijklmno
where yijklmno is the dependent variable; µ is the general mean of the model; herd typei is the fixed
effect of herd type described above i (i = 1, ..4), HTD (herd type)i:j is the random effect of herd test
day within the herd type ( j = 1,…26), Parityk is the fixed effect of parity k of the cow (k = 1: first
parity, k = 2: second parity, k = 3: third and k = 4: fourth parity), DIMk is the fixed effect of days in
milk class k (10 classes of 60-d interval, with the exception of the last class, which included
samples collected at DIM 600 days or greater), BREEDl is the fixed effect of breed (l = 1,…6 ) and
eijklmn is a random residual.
Orthogonal contrasts (P < 0.05) were estimated between LSM of traits for the effect of
breed: a) specialized purebreds vs. local dual purpose purebreds; b) Holstein-Friesian and Brown
Swiss vs. Jersey; c) Holstein-Friesian vs. Brown Swiss; d) Simmental vs. Rendena and Gray
Alpine; e) Rendena vs. Gray Alpine, and between LSM of traits for the effect of herd type: a)
modern vs. traditional herd types; b) traditional with silage vs. traditional without grazing and
traditional original; c) traditional without grazing vs. traditional original.
RESULTS AND DISCUSSION
Protein fraction amount and proportion
Descriptive statistics for the investigated traits are summarized in Tab. 1. On average, cows
produced 20.6 kg/d of milk containing 3.88% fat and 3.54% protein. The mean values of SCS were
2.93. The content of milk protein fractions obtained by RP-HPLC showed differences between the
protein content assessed in the national milk recording program. This could be probably explained
because kind of sample preparation, conservation options and type of technique influence attended
composition and average of the substances, in this case different protein content amount has to be
expected. Moreover protein content detected by RP-HPLC is greater than content and casein index
reported in other studies because the method is not able to provide NPN and minor components
amount, such as BSA and Ig. On the other hand, sample conditions seem to play an important role;
more favorable conservation of samples after herd collection ensure a good condition of milk for
HPLC analysis than milk collected in the milk recording program (Bonfatti et al., 2010).
Correlation between milk protein fraction detected by RP-HPLC and those obtained with
MilkoScan FT6000 of the laboratory was 0.77 for casein and 0.76 for total protein (data not shown).
Breed and Herd frequencies
Frequencies are reported in Tab. 2. The most represented breed in the multi-breed herds
sampled was the Brown Swiss with a total of 269 animals (34.80%); on the other hand Jersey
frequency was the lowest, 47 animals (6.08%). Concerning the dairy systems, the traditional
original herd attended 325 milking cows, the highest number of animals comparing with the other
dairy systems; instead traditional herd with use of silage attended 79 milking cows, the lowest
number of animals.
Sources of variation in milk protein traits
Results of ANOVA concerning protein fractions and proportions are reported in Tab. 3.
HTD within herd type affected all the tested milk protein traits (except for the κ-CN proportion
expressed as %); the dairy system exerted a smaller effect than HTD, above all on casein content
amount, especially for κ-CN and β-CN, but not on the whey protein amount. It is important
however to note that in our case effect of dairy system and collection day is confounded.
Parity was a major source of variation for all studied traits, particularly for casein content.
Stage of lactation exerted a smaller effect than parity; κ-CN, αS1-CN and β-CN, Lf and β-Lg
contents, expressed as g/L, were the most influenced traits (except for α-La and αS2-CN content).
Stage of lactation plays an important role on milk composition, because the body energy changes
and requirements of the animal get to be different; body weight of cows tend to decrease in the first
period (90 d), such as protein and fat, also the greatest energy mobilization occurred in the first 2
week of lactation (Koenen et al., 2001; Friggens et al., 2007). In the second phase, after the peak of
lactation and just until the dry period, milk production starts to decrease, but at the same time fat,
protein and body weight increase, as result of the energy balance change (Pirlo et al., 2000; Heins et
al., 2006). Protein fractions have the same trend, but κ-CN especially seem to follow more closely
the trend of the lactation curve (Bobe et al., 1998). Considering parity effect, in fact casein and
whey protein fractions showed a decrease depending on the parity level; this is in accordance with
other studies, as lactation’s number influences milk protein content. Pluriparous animals attend
milk quality which get worse, because protein average decreases (Hansen et al., 2006).
Milk yield was less important than DIM and parity, but nevertheless affected most of the
studied traits, especially the casein content, that decreases when compared with higher milk
production. Milk yield affected milk composition and it depends on many factors, like animal
selection and breeding programs, but also health status of the cow and feeding systems (Friggens et
al., 1995; Veritè and Delaby, 2000; Brun-Lafleur et al., 2010; Dekleva et al., 2012).
Breed effect was highly significant (P<0.001) for all the investigated traits, with the
exception of αS1-CN and αS2-CN proportion (expressed as %).
Breed Effect for milk Protein Fraction and Composition
Least square means and significance values for the contrasts among different breeds in term
of milk protein fractions (g/L) and proportion (%) are reported in Table 4.
On average, J cows showed the highest total casein and whey protein amount, 44.06 and
7.11 g/L respectively, comparing with the other breeds, and on the other hand HF attended the
worst, 33.42 and 6.30 g/L respectively. BS cows showed a good protein level, 38.26 g/L concerning
casein content and 6.92 g/L concerning whey content; as dual-purpose breeds, GA and R showed
similar protein content.
Breed combinations showed that, for casein content, all types of comparison were highly
significant (P < 0.001), with the exception of GA vs R. Concerning Whey protein content, all kind
of combinations were highly significant (P < 0.001), except for first and second breed combination
(P < 0.05). Moreover differences were highly significant (P < 0.001) concerning κ-CN, αS1CN, αLA and β-Lg considering the different breed combinations.
Results could be partially explained by proportion of different protein and differences in the
frequency of their genetic variants; several studies considered the relationship that exists among
these kind of traits; the casein genes are closely linked and organized in a casein locus located in
bovine chromosome 6, but it is difficult to determine whether the effect of a casein variant is
specific to another casein fraction or is maybe an effect of another casein gene, close linked. Heck
et al., 2009 found that B variant of κ-CN is associate with a greater relative concentration of total κCN and α-LA, but other studies are in disagreement because no effect have been reported (Bobe et
al., 1999); breeds which are selected for B variant of κ-CN, like BS, attended a more appreciable
milk quality, because of the highest casein content given by this genetic variant. On the other hand,
HF is not selected for B variant of κ-CN, and consequently this breed showed higher frequency of
AB and AA genotypes for κ-CN; this combination affects whey composition of milk, because A
variant of κ-CN is correlated to a lower total casein and α-LA amount, in accordance with other
investigations (Mclean et al., 1984; Ng-Kwai-Hang et al., 1986; Lunden et al., 1996; Huang et al.,
2012).
J breed has naturally greater casein content, if compared with other breeds, and this
characteristic could partially explain the differences between HF and BS.
Concerning dual-purpose breed combinations, literature reported that SI seem to exhibit
more equilibrated allelic frequencies at milk protein genes (Bonfatti et al., 2010). This however give
not significant variation if compared with GA and R. Considering κ-CN content, GA showed a
higher amount of this kind of protein fraction than R, 4.44 and 4.13 g/L respectively. Differences
are not so high, although GA attended a higher frequency of B variant of κ-CN than R (data not
shown). Moreover high significance (P < 0.001) was observed for β-Lg content and whey protein
amount; this is probably explained by the genotype frequencies attended; in fact R breed showed a
higher frequency of B variant of β-Lg, GA breed instead showed a higher frequency of A variant of
β-Lg. In literature is reported that concerning β-Lg, A variant is strongly associated with a greater
relative concentration of β-Lg and a lesser concentration of the other major milk proteins (Lum et
al., 1997; Heck et al., 2009); obviously higher β-Lg concentration carries out a higher total whey
amount.
Concerning LF, on our knowledge, this is the first study in dairy science which employed a RPHPLC method able to detect Lf with all the other milk protein fractions, in one chromatographic
run.
It has been well established that iron is an essential nutrient for the growth of a lot of
bacteria species and often bacteria are exposed to iron-limited conditions (Jenssen et al., 2009); in
response of this, many bacteria synthesize and secrete phenolate and siderophores, which have a
greater affinity for iron than lactoferrin or transferring. More recently, it has become that some of
the antimicrobial properties of lactoferrin are independent of iron-binding (Farnauld et al., 2003).
Susceptibility of bacteria was found to be dependent on their growth phase, especially the early log
phase, because lactoferrin N-terminal region interact reversibly with porins of bacteria membrane
or other direct interaction of the protein or its fragment with ions target (Naidu et al., 1993; ElassRochard et al., 1995). In our work no differences were observed for Lf content between breeds
combinations; in literature just a few investigations focused on Lf and its physiological role in dairy
cows; a correlation between Lf concentration in milk and stage of lactation, fat and protein
percentage and SCS was found (Krol et al., 2013; Cheng et al., 2009; Arnould et al., 2009), this
may suggest that Lf content could be potentially used as mastitis indicator (Harmon et al., 1976;
Farnauld and Evans, 2003). In our work just Lf amount (g/L) was significantly different between
Holstein-Friesian and Brown Swiss (P < 0.01)..
In our work, Holstein Friesian showed a higher percentage of Lf proportion and also a
higher SCS than Brown Swiss (data not shown); we can also argue that animals with a high
concentration of somatic cells have an increasing of Lf concentration, also Lf is positively
correlated with SCS and more generally with the health status of the animals and seems to modulate
the inflammatory process (Soyeurt et al., 2007); this aspect is in agreement with other works
(Hagiwara et al., 2003; Chaneton et al., 2008 and 2011; Simijoki et al., 2010).
Dairy System Effect for milk Protein Fractions and Composition
Least square means and significance values for the contrasts among different dairy systems
in term of milk protein fractions (g/L) and proportion (%) are reported in Table 5.
On average, traditional herd with silage use showed the highest total casein and whey
protein amount, 40.52 and 7.02 g/L respectively, comparing with the other dairy systems, and on
the other hand traditional herd without grazing attended the worst, 34.85 and 6.22 g/L respectively.
Traditional original herd showed a good protein level, 37.70 g/L concerning casein content and 6.81
g/L concerning whey content; on the other hand modern herd showed a lower protein fraction
amount and proportion than the traditional original herd.
Combinations among all dairy systems that showed high significance (P < 0.001) were those
for the total casein content, the αS1-CN and the β-CN fraction amount; no significant differences
were observed for αS2-CN, αS1-CN and β-LG proportions. Significance was found for whey protein
content too.
Several works considered environmental interactions on productive performances of dairy
cows. Nutritional management factors affecting nutritional intake are associated with G x E
interactions; as consequence, less feed consuming or low energy diet may affect the expression of
the production potential of dairy cows (Kennedy et al., 2002; Horan et al., 2005; Dekleva et al.,
2012). Moreover milk production is greatly determined by dry matter intake and by the efficiency
digestion of the diet; purebred like Holstein Friesian, selected for milk production since a long time,
are well managed in farm systems where quantity and quality of nutrient offered can be controlled,
and adjustment of the diet for cow’s requirements are common practice to optimize milk production
(Bargo et al., 2003; Mattiauda et al., 2013). It has to consider that increased productivity of such
breeds is negative correlated with health traits and fitness; high-production breeds were also less
selected for robustness and feed intake than local low-production breeds (McCharty et al., 2007; De
Marchi et al., 2007).
In our work, is important to note that the best kind of dairy system strategy seem to be the
traditional herd with silage use, comparing with the others dairy systems. As explained before, feed
intake and ingestion capability are strictly related to animal requirements and to the morphological
and physiological characteristics, and also milk production is associated with feed quality and
composition. Rotational grazing during the summer period could be an economical way of feeding
dairy cows, but often it is difficult to sustain maximum milk yield with high producing cows (Wu et
al., 2001). Silage supplementation could be a good strategy for supporting milk production at
pasture, increasing the genetic potential of breeding animals (Bovolenta et al., 2009). For these
reasons, this kind of herd type gave the best performance considering milk protein fraction amount
and milk protein proportion, in fact animals can better integrate their nutritional requirements and
improve the energy balance; milk composition depends also from protein attended in diet, so greater
protein yield may be correlated with protein supplementation of silage; our results are in accordance
also with other works (Burgess et al., 1984; Kokkonen et al., 2000). Surprisingly, Lf content was
greater for this kind of herd and contrasts between the traditional original herd and the traditional
herd without grazing showed high significance (P < 0.001); unexpectedly traditional herds with
silage use presented the best protein average content in milk, but also the highest Lf amount and
SCS too, possible indicator of inflammatory processes and mastitis; our results could be partially
explained
probably because overfeeding with protein in the diet, in this case silage
supplementation, affects milk protein level and health status of the animals, with and increasing of
infections susceptibility (Frank and Swensson, 2002).
On the other hand, traditional herd without any kind of feed supplementation and nutritional
help for cow’s requirements seem to be the worst kind of strategy in mountain area system,
probably because cows cannot provide to optimize their energy balance, with a worsening of milk
production and milk composition. Surprisingly, modern herd type with unifeed use did not give the
best results concerning milk protein fractions.
CONCLUSIONS
In conclusion, we herein described a RP-HPLC method able to identify and quantify the
most common protein fractions amount of individual milk of different crossbred combinations. This
method guarantee a good resolution of peaks, content of milk proteins and genetic variants, and
content of Lf too. The possibility to analyze the complete milk protein profile just in one
chromatographic run gave us a very detailed evaluation of milk characteristics and milk quality
traits, such as genotypes and amount of milk protein and genetic variants. Protein composition
determines the nutritional value and the technological properties of milk and this indicates that
selection for specific variants can be a useful tool in selecting for animals with a desired protein
composition.
Our study considered multi-breed herds and our results showed that stage of lactation and
parity affected milk protein fractions and milk composition; milk yield and dairy system seem to
affect casein content, but no significance was found for whey protein content. Concerning breeds
and dairy systems combinations, J showed the highest milk protein amount, comparing with the
other breeds, and significant differences were found within specialized purebred cows, comparing
HF with BS, and within dual-purpose local purebred cows, comparing GA with R. The most
influenced protein fractions were κ-CN, αS-CN, α-LA and β-Lg, and genotype relationships were
discussed.
Dairy system combinations gave interesting results; our results suggest that silage use
supplementation coupled with grazing during summer can be considered the best management
practice for dairy cows in mountain areas, in fact protein average was the highest, comparing with
the other herd types. It has to be noted however that Lf content was the highest, including SCS. On
the other hand, removing grazing and silage supplementation cannot provide to the best diet
strategy and support for the cow’s performances.
Environment plays a key role on genotype and on potential of productive performances of
animals. Surely further investigations are required to better understand the environmental action on
milk protein content and genotypes; therefore, further studies on milk protein profiles and the
genetic variants of different protein fractions could better explain the differences found among
breed and dairy system groups.
REFERENCES
Arnould, V. M.-R., H. Soyeurt, N. Gengler, F. G. Colinet, M. V. Georges, C. Bertozzi, D.
Portetelle, and R. Renaville. 2009. Genetic analysis of lactoferrin content in bovine milk. J.
Dairy Sci. 92: 2151-2158.
Adamec, V., B. G. Cassell, E. P. Smith, and R.E. Pearson. 2006. Effects of inbreeding in the dam
on dystocia and stillbirths in US Holsteins. J. Dairy Sci. 89:307-314.
Bargo, F., L. D. Muller, E. S. Kolver, and J. E. Delahoy. 2003. Invited review: production and
digestion of supplemented dairy cows on pasture. J. Dairy Sci. 86:1-42.
Bittante, G., M. Penasa, and A. Cecchinato. 2012. Invited review: Genetics and modeling of milk
coagulation properties. J. Dairy Sci. 95:6843-6870.
Bobe, G., D. C. Beitz, A. E. Freeman, and G. L. Lindberg. 1998. Separation and quantification of
bovine milk proteins by reversed phase high performance liquid chromatography. J. Agric.
Food Chem. 46:458-463.
Bonfatti V., G. Di Martino, A. Cecchinato, D. Vicario, and P. Carnier. 2010. Effects of β-κ-casein
(CSN2-CSN3) haplotypes and β-lactoglobulin (BLG) genotypes on milk production traits
and detailed protein composition of individual milk of Simmental cows. J. Dairy Sci.
93:3797-3808
Bonizzi I., J. N. Buffoni, and M. Feligini. 2009. Quantification of bovine casein fractions by direct
chromatographic analysis of milk. Approaching the application to a real production context.
J. Chromatogr A. 1216:165-168.
Bovolenta, S., M. Corazzin, E. Saccà, F. Gasperi, F. Biasioli, and W. Ventura. 2008. Performance
and cheese quality of brown cows grazing on mountain pasture fed two different levels of
supplementation. Livest. Sci. 124:58-65.
Brun-Lafleur, L., L. Delaby, F. Husson, and P. Faverdin. 2010. Predicting energy x protein
interaction on milk yield and milk composition in dairy cows. J. Dairy Sci. 93: 4128-4143.
Burgess, P. L., and J. W. G. Nicholson. 1984. Protein level in grass silage-based total mixed rations
for dairy cows in mid-lactation. Can. J. Anim. Sci. 64:435-442.
Cassandro, M. 2003. Status of milk production and market in Italy. Agricolturae Conspectus
Scientificus. Vol. 68(2), pp. 65-69, ISSN: 1331-7768.
Cecchinato, A., M. Penasa, M. De Marchi, L. Gallo, G. Bittante, and P. Carnier. 2011. Genetic
parameters of coagulation properties, milk yield, quality, and acidity estimated using
coagulating and noncoagulating milk information in Brown Swiss and Holstein-Friesian
cows. J Dairy Sci. 94:4214-4219.
Chaneton, L., J. M. Pèrez Sáez, and L. E. Bussmann. 2011. Antimicrobial activity of bovine βLactoglobulin against mastitis-causing bacteria. J. Dairy Sci. 94:138-145.
Corazzin, M., S. Dovier, E. Bianco, and S. Bovolenta. 2009. Survey on welfare of dairy cow in tiestalls in mountain area. Ital. J. Anim. Sci. 8(Suppl. 2):610-612.
De Marchi, M., G. Bittante, R. Dal Zotto, C. Dalvit, and M. Cassandro. 2008. Effect of HolsteinFriesian and Brown Swiss Breeds on quality of milk and Cheese. J. Dairy Sci. 91:40924102.
De Marchi, M., R. Dal Zotto, M. Cassandro, and G. Bittante. 2007. Milk coagulation ability off ive
dairy cattle breeds. J Dairy Sci. 90:3986-3992.
Dekleva, M. W., C. D. Dechow, J. M. Daubert, W. S. Liu, G. A. Varga, S. Bauck, and B. W.
Woodward. 2012. Short communication: interactions of milk, fat, and protein yield
genotypes with herd feeding characteristics. J. Dairy Sci. 95:1559-1564.
Elass-Rochard, E., A. Roseanu, D. Legrand, M. Trif, V. Salmon, C. Motas, J. Montreuil, and G.
Spik. 1995. Lactoferrin-lipopolysaccharide interaction: involvement of the 28-34 loop
region of human lactoferrin in the high-affinity binding to Escherichia coli 055B5
lipopolysaccharide. J. Biochem. 312:1080-1091.
Farnauld. S., and R. W. Evans. 2003. Lactoferrin – a multifunctional protein with antimicrobial
properties. Mol. Immun. 40:395-405.
Farrell H. M., Jr., R. Jimenez-Flores, G. T. Bleck, E. M. Brown, J. E. Butler, L. K. Creamer, C. L.
Hicks, C. M. Hollar, K. F. Ng-Kwai-Hang, and H. E. Swaisgood. 2004. Nomenclature of the
proteins of cows’ milk-sixth revision. J. Dairy Sci. 87:1641-1674.
Frank, B., and C. Swensson. 2002. Relationship between content of crude protein in rations for
dairy cows and milk yield, concentration of urea in milk and ammonia emissions. J. Dairy
Sci. 85:1829-1838.
Friggens N. C., P. Berg, P. Theilgaard, I. R. Korsgaard, K. L. INgvartsen, P. Løvendahl, and J.
Jensen. 2007. Breed and parity effects on energy balance profiles through lactation:
evidence of genetically driven body energy change. J. Dairy Sci. 90:5291-5305.
Hagiwara, S.-I, K. Kawai, A. Anri, and H. Nagahata. 2003. Lactoferrin concentrations in milk from
normal and subclinical mastitis cows. J. Vet. Med. Sci. 65:319-323.
Hallèn E., A. Wedholm, A. Andrèn, and A. Lundèn. 2007. Effect of β-casein, κ-casein and βlactoglobulin genotypes on concentration of milk protein variants. J. Anim. Breed. Genet.
125:119-129
Hansen, J. V., N. C. Friggens, and S. Højsgaard. 2006. The influence of breed and parity on milk
yield, and milk yield acceleration curves. Livest. Sci. 104:53-62.
Harmon, R. J., F. L. Schanbacher, L. C. Ferguson, and K. L. Smith. 1976. Changes in lactoferrin,
immunoglobulin G, bovine serum albumin, and α-lactalbumin during acute experimental
and natural coliforms mastitis in cows. Infect. Immun. 13:533-542.
Heck, J. M. L., A. Schennink, H. J. F. van Valenberg, H. Bovenhuis, M. H. P. W. Visker, J. A. M.
van Arendonk, and A. C. M. van Hooijdonk. 2009. Effects of milk protein variants on the
protein composition of bovine milk. J. Dairy Sci. 92:1192-1202.
Heins B. J., L. B. Hansen, and A. J. Seykora. 2006. Production of pure Holstein versus crossbreds
of Holstein with Normande, Monbeliarde, and Scandinavian Red. 2006. J. Dairy Sci.
89:2799-2804.
Horan, B., P. Dillon, P. Faverdin, L. delaby, F. Buckley, and M. Rath. 2005. The interaction of
strain of Holstein-Friesian cows and pasture-based feed systems on milk yield, body weight,
and body condition score. J. Dairy Sci. 88:1231-1343.
Huang W., F. Peñagaricano, K. R. Ahmad, J. A. Lucey, K. A. Weigel, and H. Khatib. 2012.
Association between milk protein gene variants and protein composition traits in dairy
cattle.
Jennsen, H., and R. E. W. Hancock. 2009. Review: antimicrobial properties of lactoferrin. Biochim.
91:19-29.
Jensen, H. B., J. W. Holland, N. A. Poulsen, and l. B. Larsen. 2012. Milk protein genetic variants
and isoforms identified in bovine milk representing extremes in coagulation properties. J.
Dairy Sci. 95:2891-2903.
Kalač Pavel. 2011. The effects of silage feeding on some sensory and health attributes of cow’s
milk: a review. Food Chem. 125:307-317.
Kennedy, E., M. McEvoy, J. P. Murphy, and M. O’Donovan. 2009. Effect of restricted access time
to pasture on dairy cow milk production, grazing behavior, and dry matter intake. J. Dairy
Sci. 92:168-176.
Koenen, E. P. C., R. F. Veerkamp, P. Dobbelaar, and G. De jong. 2001. Genetic analysis of body
condition score of lactating dutch Holstein and red-and-white heifers. J. Dairy Sci. 84:12651270.
Kokkonen, T., M. Tuori, V. Leivonen, and L. Syrjälä-Qvist. 2000. Effect of silage dry matter
content and rapeseed meal supplementation on dairy cows. 1. Milk production and feed
utilization. Anim. Feed Sci. Tech. 84:213-228.
Król J., A. Brodziak, Z. Litwińczuk, and A. Litwińczuk. 2013. Effect of age and stage of lactation
on whey protein content in milk of cows of different breeds.
Leiber, F., M. Kreuzer, H. Leuenberger, and H. R. Wettstein. 2006. Contribution of diet type and
pasture conditions to the influence of high altitude grazing on intake, performance and
composition and renneting properties of the milk of cows. Anim. Res. 55:37-53.
Lopez, H., L. D. Satter, and M. C. Wiltbank. 2004. Relationship between level of milk production
and oestrus behavior of lactationg dairy cows. Anim. Repr. Sci. 81:209-223.
Lopez-Villalobos N., D. J. Garrick, C. W. Holmes, H. T. Blair, and R. J. Spelman. 2000. Effects of
selection and crossbreeding strategies on industry profit in the New Zealand dairy industry.
J. Dairy Sci. 83:164-172.
Lum, L. S., P. Dove, and J. F. Medrano. 1997. Polymorphisms of bovine beta-lactoglobulin
promoter and differences in the binding affinity of activator protein -2 transcription factor. J.
Dairy Sci. 80:1389-1397.
Lundèn A., M. Nilsson, and L. Janson. 1997. Marked effect of β-lactoglobulin polymorphism on
the ratio of casein to total protein in milk. J. Dairy Sci. 80:2996-3005.
Mattiauda, D. A., S. Tamminga, M. J. Gibb, P. Soca, O. Bentancur, and P. Chilibroste. 2013.
Restricting access time at pasture and time of grazing al location for Holstein dairy cows:
ingestive behaviour, dry matter intake and milk production. Livest. Sci. 152:53-62.
Maurmayr A., A. Checchinato, L. Grigoletto, and G. Bittante. 2013. Detection and quantification of
αS1-, αS2-, β-, κ-casein, α-Lactalbumin, β-lactoglobulin and lactoferrin in bovine milk by
reverse-phase high-performance liquid chromatography. Agric. Conspec. Sci.. 78:201-205.
McCharty, S., B. Horan, P. Dillon, P. O’Connor, M. Rath, and L. Shalloo. 2007. Economic
comparison of divergent strains of Holstein-Friesian cows in various pasture-based
production systems. J. Dairy Sci. 90:1493-1505.
Mclean D. M., E. R. Graham, R. W. Ponzoni, and H. A. McKenzie.1994. Effects of milk protein
genetic variants on milk yield and composition. J. Dairy Res. 51:531-546.
Naidu, S. S., U. Svensson, A. R. Kishore, and A. S. Naidu. 1993. Relationship between antibacterial
activity and porin binding of lactoferrin in Escherichia coli and Salmonella Typhimurium.
Antimicrob. Agents Chemother. 37:240-245.
Ng-Kwai-Hang K. F., J. F. Hayes, J. E. Moxley, and H. G. Monardes. 1984. Association of genetic
variants of casein and milk serum proteins with milk, fat, and protein production by dairy
cattle. J. Dairy Sci. 67:835-840.
Ng-Kwai-Hang, K. F., J. F. Hayes, J. E. Moxley, and H. G. Monardes. 1986. Relationships
between milk protein polymorphisms and major milk constituents in Holstein-Friesian cows.
J. Dairy Sci. 69:22-26.
Ng-Kwai-Hang, K. F and F. Grosclaude. 2003. Genetic Polymorphism of milk proteins. Advanced
Dairy Chemistry, Vol 1: Proteins, pp. 739-816. Edited by P. F. Fox and P. L. H.
McSweeney. Springer US.
Penati, C., P. B. M. Beretsen, A. tamburini, A. Sandrucci, and I. J. M. de Boer. 2011. Effect of
abandoning highland grazing on nutrien balances and economic performance of italian
Alpine dairy farms. 2011. Livest. Sci. 139:142-149.
Pirlo G., F. Miglior, and M. Speroni. 2000. Effect of age at first calving on production traits ond on
difference between milk yield returns and rearing costs in italian Holstein. J Dairy Sci.
83:603-608.
Pretolani, R, and R. Raffaelli. 2007. Differenziali di costo e valorizzazione delle risorse territoriali
nella produzione di latte di montagna. In: Folloni, G., Cannata, G., Gorla, G., (Eds.),
Lavorare e vivere in montagna: Svantaggi strutturali e costi aggiuntivi. Bonomia University
Press, pp. 27-58.
VanRaden P. M., and A. H. Sanders. 2003. Economoic merit of crossbred and purebred US dairy
cattle. J. Dairy Sci. 86:1036-1044
Simijoki, H., P. Hyvönen, T. Orro, and S. Pyörälä. 2010. High concentration of human lactoferrin
in milk of rhLf-transgenic cows relieves signs of bovine experimental Staphylococcus
chromogenes intramammary infection.
Soyeurt, H., F. G. Colinet, V. M.-R. Arnould, P. Dardenne, C. Bertozzi, R. Renaville, D. Portetelle,
and N. Gengler. 2007. Genetic variability of lactoferrin content estimated by mid-infrared
spectrometry in bovine milk. J. Dairy Sci. 90:4443-4450.
Sturaro, E., E. Marchiori, G. Cocca, M. Penasa, M. Ramanzin, and G. Bittante. 2013. Dairy systems
in mountainous areas: farm animal biodiversità, milk production and destination, and land
use. Livest. Sci. 158: 157-168.
Veritè, R., and L. Delaby. 2000. Relation between nutrition, performances and nitrogen excretion in
dairy cows. Ann. Zootech. (Paris) 49:217-230.
Wu, Z., V. R. Kanneganti, L. J. Massingill, M. C. Wiltbank, R.P. Walgenbach, and L. D. Satter.
2001. Milk production of fall-calving dairy cows during summer grazing of grass-clover
pasture. J. Dairy Sci. 84:1166-1173.
Table 1. Descriptive statistics for milk protein fractions composition (% of total protein) and
content (g/L) and milk quality traits of individual samples of purebred cows (n = 773)
g/l milk
% of total protein
Trait2
Mean
SD
P11
P99
Mean
SD
P11
P99
Caseins ,
84.40
2.81
74.88
93.51
36.31
6.58
23.67
53.57
κ-CN
9.93
1.95
3.37
16.24
4.29
1.18
1.29
8.39
α-S2-CN
8.37
1.60
3.70
14.79
3.63
0.99
1.25
6.64
α-S1-CN
27.77
2.40
15.86
34.59
11.98
2.24
6.12
19.22
β-CN
32.15
2.74
17.05
41.12
13.77
2.33
4.77
21.60
Whey proteins
15.59
2.81
6.48
25.11
6.67
1.53
3.41
10.84
Lf
0.22
0.11
0.05
0.85
0.09
0.05
0.02
0.34
α-LA
2.27
0.47
1.04
5.99
0.96
0.18
0.45
1.71
β-Lg
13.09
2.81
4.68
22.65
5.61
1.49
2.06
11.29
Fat
38.8
8.1
14.1
61.5
Protein
35.4
5.0
26.1
49.0
SCS, units
2.93
1.90
-0.64
7.29
20.61
4.01
13.20
26.72
Milk quality traits
Milk yield, kg/d
1
2
P1 = first percentile; P99 = 99th percentile.
Contents of all protein fractions were measured by reversed-phase HPLC on skim milk. Caseins =
sum of total casein fraction; Whey proteins = sum of total whey fractions
Tab. 2 Breed and herd type frequencies (n=773)
Item
N
Percentage, %
Brown swiss
269
34.80
Holstein-Friesian
180
23.39
Grey Alpine
75
9.70
Jersey
47
6.08
Simmentahl
99
12.81
Rendena
103
13.32
Modern
204
26.39
traditional with silage
79
10.22
traditional without grazing
165
21.35
traditional original
325
42.04
Breed
Dairy system
1
Tab. 3 Results from ANOVA (F-value and significance) for milk protein fractions proportion (%) and content (g/L)
Trait
Milk proteins, %
2
3
4
Herd(dairy system)
Caseins
5.87***
κ-CN
1.08 ns
α-S2-CN
2.55***
α-S1-CN
2.90***
β-CN
5.47***
Whey proteins
5.87***
Lf
4.24***
α-LA
6.47***
β-Lg
4.72***
Milk proteins, g/L
Caseins
5.34***
κ-CN
1.88***
α-S2-CN
2.66***
α-S1-CN
5.93***
β-CN
5.77***
Whey proteins
4.43***
Lf
4.52***
α-LA
7.24***
β-Lg
3.79***
1
RMSE = Root means square error;
* P < 0.05; ** P < 0.01; *** P < 0.001
Dairy system
DIM
Parity
MY
Breed
RMSE
R2
0.22 ns
4.32**
0.29 ns
0.69 ns
0.67 ns
0.22 ns
0.77 ns
0.59 ns
0.22 ns
0.80 ns
6.02***
2.77***
0.51 ns
0.67 ns
0.80 ns
1.86*
6.58***
1.03 ns
6.34***
2.37ns
4.16***
5.61***
4.27***
6.34***
1.65 ns
0.25 ns
6.75***
0.23 ns
2.80*
1.10 ns
2.64*
2.92*
0.23 ns
0.22 ns
1.84 ns
0.21 ns
11.79***
24.91***
1.40 ns
3.25***
13.75***
11.79***
4.91***
12.93***
12.39***
2.49
1.64
1.78
2.65
2.42
2.48
0.10
0.39
2.51
0.27
0.34
0.15
0.15
0.31
0.27
0.22
0.37
0.26
4.31**
7.87***
1.77 ns
2.23 ns
3.95*
1.73 ns
1.06 ns
1.03 ns
1.70 ns
8.68***
2.59***
1.01 ns
5.72***
8.68***
4.59***
3.55***
1.23 ns
4.73***
14.58***
3.17*
7.52***
12.73***
18.61***
1.24 ns
2.58*
10.18***
1.45 ns
3.88***
1.75 ns
2.06 ns
4.73***
10.35***
1.75 ns
0.63 ns
0.81 ns
1.61 ns
28.42***
45.86***
10.40***
14.35***
1.15 ns
10.91***
2.01ns
9.76***
11.58***
4.71
0.87
0.98
2.06
1.79
1.29
0.04
0.15
1.27
0.51
0.48
0.28
0.41
0.44
0.32
0.23
0.34
0.31
Tab. 4 Least squares means of milk protein fractions composition (% of total protein) and milk protein fractions content (g/L) across breeds
Item
Breeds
specialized, S
F
84.0
9.0
8.1
21.0
32.9
16.0
0.24
2.3
13.4
Fr+BS vs J
***
***
ns
ns
FR vs BS
*
***
ns
*
SI vs GR+R
***
***
ns
**
R vs GR
***
ns
ns
ns
ns
*
***
ns
***
ns
***
***
*
***
***
ns
***
ns
***
***
***
ns
ns
***
Caseins
g/L 38.26
33.42
44.06 36.75
35.32
34.33
***
κ-CN
g/L 4.85
3.60
5.85
4.44
3.79
4.13
***
α-S2-CN
g/L 3.87
3.24
4.53
3.61
3.43
3.33
***
αS1-CN
g/L 12.47
11.20
14.52 11.90
12.13
10.99
***
β-CN
g/L 14.17
13.09
15.62 13.98
13.53
13.70
***
Whey proteins
g/L 6.92
6.30
7.11
6.84
7.03
5.46
*
Lf
g/L 0.08
0.09
0.09
0.10
0.10
0.09
ns
α-LA
g/L 0.96
0.89
1.01
1.04
0.92
1.00
*
β-Lg
g/L 5.88
5.31
6.00
5.69
6.00
4.36
***
* P < 0.05; ** P < 0.01; *** P < 0.001
1
BS: Brown Swiss; F: Holstein-Friesian; J: Jersey; GR: Gray Alpine; SI: Simmental; R: Rendena
***
***
***
***
***
*
ns
***
ns
***
***
***
***
***
***
ns
***
***
ns
***
ns
*
ns
***
ns
***
***
**
ns
ns
*
ns
***
ns
ns
***
[Digitare il testo]
%
%
%
%
%
%
%
%
%
J
86.2
11.5
8.8
22.0
30.7
13.8
0.19
2.0
11.6
dual-purpose, DP
GR
SI
R
84.3
83.3
86.3
10.2
9.0
10.4
8.3
8.1
8.5
20.0
21.1
21.0
32.2
32.1
34.5
15.7
16.7
13.7
0.23
0.24
0.23
2.5
2.2
2.6
13.1
14.2
10.9
S vs DP
ns
***
ns
ns
Caseins
κ-CN
α-S2-CN
αS1-CN
β-CN
Whey proteins
Lf
α-LA
β-Lg
BS
84.6
10.8
8.6
21.0
31.4
15.4
0.18
2.1
13.0
Contrast, P values
Tab. 5 Least squares means of milk protein fractions composition (%) and milk proteins fractions content (g/L) across dairy systems
Dairy system:
Item
Modern
Silage
Caseins
κ-CN
α-S2-CN
αS1-CN
β-CN
Whey
proteins
Lf
α-LA
β-Lg
Traditional
No silage:
No summer Original
grazing
Modern vs
Traditional
Silage vs
No silage
Original vs
No grazing
%
%
%
%
%
%
84.5
9.8
8.6
28.3
31.8
15.5
85.3
10.6
8.3
28.0
32.5
14.7
84.7
10.3
8.3
27.5
32.7
15.3
84.6
9.8
8.4
27.9
32.3
15.4
ns
**
ns
ns
***
ns
ns
*
ns
ns
ns
ns
ns
*
ns
ns
ns
ns
%
%
%
0.22
2.3
13.0
0.24
2.1
12.3
0.22
2.4
12.7
0.20
2.3
12.9
ns
ns
ns
*
***
ns
*
ns
ns
34.85
4.24
3.40
11.35
13.37
6.22
37.70
4.42
3.75
12.46
14.27
6.81
***
***
ns
***
***
*
***
***
**
***
***
**
***
ns
***
***
***
***
0.09
0.96
5.17
0.08
1.01
5.71
ns
***
ns
***
ns
**
ns
***
***
Caseins
g/L
35.03
40.52
κ-CN
g/L
4.06
5.05
α-S2-CN g/L
3.58
3.95
αS1-CN
g/L
11.71
13.29
β-CN
g/L
13.11
15.32
Whey
g/L
6.39
7.02
proteins
Lf
g/L
0.09
0.11
α-LA
g/L
0.93
0.99
β-Lg
g/L
5.37
5.91
† P <0.10; * P < 0.05; ** P < 0.01; *** P < 0.001
[Digitare il testo]
Contrast, P values
[Digitare il testo]
GENERAL DISCUSSION AND CONCLUSIONS
Milk protein is absolutely of great interest for dairy research and one of the most studied substances
in food. However, many biological aspects and characteristics involving milk protein fraction, milk
proportion, coagulation ability of milk and their relationship are unknown or unclear yet.
Investigation concerning milk protein fraction and milk composition is particularly difficult, and
additional care has to be considered if new researches, protocols and methodological approaches are
required or developed. Surely further knowledge is needed about analytical techniques employed in
protein identification. No methods exist which guarantee the detection and the quantification of all
milk protein fractions and their genetic variants, and often results of different kind of techniques are
so different that is impossible to compare them each other; this is an important limit, above all in
dairy science where genetic variants, genotypes, allele frequencies and estimation of genetic
parameters for animal selection and breeding programs are fundamental aspects of research.
Moreover, poor accuracy in genetic variants detection could produce bias and wrong considerations
on the extent of their effects. Furthermore, casein genes are closely linked on bovine chromosome 6
and this can partially explain the relation existing between the casein fractions on milk protein
composition, but it is difficult to determine whether the effect of a casein variant is specific to
another casein fraction or is maybe an effect of another casein gene, and often statistical analysis
cannot provide accurate estimation of genetic parameters related to milk protein genotypes and milk
composition (Bobe et al., 1999).
Results obtained in this study confirmed that relationship among milk protein fractions, such as
caseins and whey proteins, is really complicated and just partially explained; genetic variants could
be more or less expressed, and expression of some of them influences concentration of other
components. B allele of κ-CN has been widely studied because of its strong relation with cheese
making process, but its concentration determines more total casein content and influences αS-CN
and whey protein amount, such as α-La and β-lactoglobulin. κ-CN and β-Lg also seem to exert a
significant part of the genetic control of αs1-CN in total milk protein, but their effects on the
proportion of other proteins in total milk proteins are minor or insignificant (Bobe et al., 2004).
Moreover variation of glycosilation of κ-CN, could be more considered in future studies, because
its probably influence on milk coagulation properties (Tyriseva et al., 2008).
Today selection goals are casted to improve performances of the animals, ensuring good
management practices and health status too. Our results suggest that crossbreeding could be an
optimal way to satisfy these requirements; crosses breeds show higher performances compared with
pure breeds, although some crosses are better than other. In our study Montbeliarde and Brown
Swiss crosses showed high total casein content, because of the high presence of B variant of κ-CN,
[Digitare il testo]
and this aspect is an advantage in countries, like Italy, where technological properties of milk are
fundamental. On the other hand Swedish Red, and related crosses with the other breeds, showed
worse milk protein content, because of the high frequency of A variant of κ-CN, like pure Holstein.
Nevertheless more information are needed; effect of κ-CN is known, but β-CN, especially B allele,
seems to play an equally role in protein expression and milk casein concentration and its
relationship has to investigated in depth (Di Stasio and Mariani, 2000; Wedholm et al., 2006).
Milk protein fractions showed different trends concerning stage of lactation and parity effect; some
milk protein decrease during the first three months of lactation and increase after this period until
the dry period, like total protein, fat and body weight, but other proteins like κ-CN follow more
closely the milk lactation curve and tend to decrease in the second phase.
Works focusing on Lactoferrin are still few; our RP-HPLC method is, on our knowledge, the first
which could provide the quantification of this protein with all the others milk protein fractions;
interest about this iron-binding protein has to grow, because many aspects are unknown yet. Firstly
Lactoferrin seems to be related to iron sequestration against bacteria; secondary its distribution is
asymmetrical, such as somatic cells, and it also could be considered as an indicator of mastitis or
more generally inflammation processes in dairy cows. Lactoferrin is poorly influenced by other
milk protein fractions and genetic variants, but further investigations are required to better
understand its biological role in milk, and its correlation among other molecules, like β-Lg, Ig and
BSA (Chaneton et al., 2011).
Environment plays a key role on the genotype expression on dairy traits and their interaction has to
become deeper. Consideration of feeding managements are instead limited. Our results suggest that
breed and dairy herd system are important effects on milk protein fractions and composition; Jersey
breed attends naturally a lower A variant frequency of κ-CN compared with the other breeds, and
this aspect carries out more appreciable milk casein and total protein content than other breeds, like
Brown Swiss, although selected for the B allele of κ-CN. Our reverse phase HPLC method was able
to identify a probably new κ-CN variant (C variant?), which frequency is higher in Gray Alpine.
Relationship among this new variant and expression of other caseins or whey proteins and
technological properties of milk could be better investigated in the future. Simmental breed showed
the worst milk protein content, compared with the other two dual-purpose breeds, and no
differences were found among Gray Alpine and Rendena.
Our results suggest that dairy herd system in mountainous areas exerted an important effect on milk
protein content and composition. Curiously, modern dairy system cannot provide to the best
performances on milk protein, while feed supplementation in traditional herds with silage and
summer grazing gave the best results in terms of milk protein amount, although health of animals
[Digitare il testo]
seems to be destabilized. Few studies exist that analyzed nutritional aspects in multi-breeds herds,
considering different breeds, which carry different milk production level, and were objective of
selection or not in time. Some considerations can be done: nutritional management factors affecting
nutrient intake are associated with genotype and environment interaction; less feed offered to cows
not capable of consuming or providing a diet with low energy concentration do not allow cows to
fully express their production; local breeds should to be safeguarded, because they can optimally
adapt to the strong environmental conditions. Genetic potential of large cows under restricted
conditions, such as feed intake and low energy of feed, is more severely limited than the genetic
potential of smaller cows (Dekleva et al., 2012).
At the experimental level, RP-HPLC is an useful and profitable method to perform this kind of
analysis and to obtain good quantification of milk protein amount, although some alleles cannot be
found, particularly for β-CN, because of the similar elution time of the genetic variants, and some
protein fractions, such as BSA and Ig cannot be detected with this method. To obtain better results
and more appreciable information about dairy traits like milk, HPLC method needs time to be
optimized, possibly through different sample preparation, or kind of solvents, or column
characteristics; HPLC could to be coupled with other techniques too, equally precise, rapid, and
easily-automated.
Other questions, such as expression level of milk proteins , environmental effect on the potential
expression of the animals, genotype effect on the protein content, remain to be solved.
[Digitare il testo]
REFERENCES
Bobe G., D. C. Beitz, A. E. Freeman, and G. L. Lindberg. 1999. Effect of milk protein genotypes on
milk protein composition and its genetic parameters estimates. J. Dairy. Sci. 82:2797-2804.
Bobe G., A. E. G. Freeman, G. L. Lindberg, and D. C. Beitz. 2004. Milk protein genotypes explain
variation of milk protein composition. Anim. Ind. Report ASL R1901.
Chaneton, L., J. M. Pèrez Sáez, and L. E. Bussmann. 2011. Antimicrobial activity of bovine βLactoglobulin against mastitis-causing bacteria. J. Dairy Sci. 94:138-145.
Di Stasio, L., and P. Mariani. 2000. The role of protein polymorphism in the genetic improvement
of milk production. Zoot. Nutr. Anim. 26:69-90.
Dekleva, M. W., C. D. Dechow, J. M. Daubert, W. S. Liu, G. A. Varga, S. Bauck, and B. W.
Woodward. 2012. Short communication: interactions of milk, fat, and protein yield
genotypes with herd feeding characteristics. J. Dairy Sci. 95:1559-1564.
Tyrisevä, A. M., K. Elo, A. Kuusipuro, V. Vilva, I. Jänönen, H. Karjalainen, T. Ikonen, and M.
Ojala. 2008. Chromosomal regions underlying noncoagulation of milk in Finnish Ayrshire
cows. Genetics 180(2), 1211-1220.
Wedholm A., L. B. Larsen, H. Lindmark-Månsson, A. H. Karlsson, and A Andrèn. 2006. Effect of
protein composition on the cheese making properties of milk from individual dairy cows. J.
Dairy Sci. 89:3296-3305.
[Digitare il testo]
[Digitare il testo]
© Copyright 2026 Paperzz