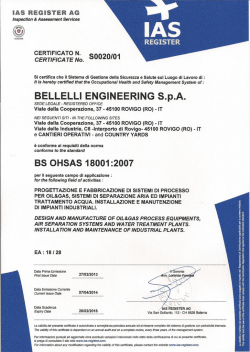
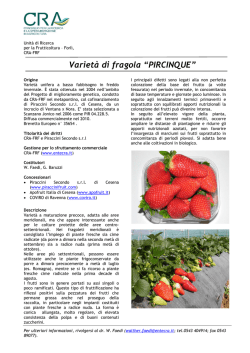
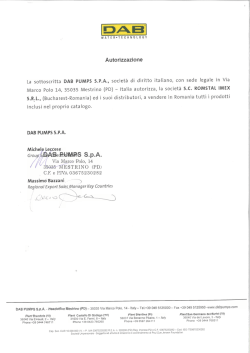
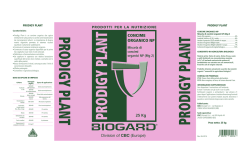
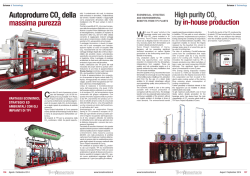
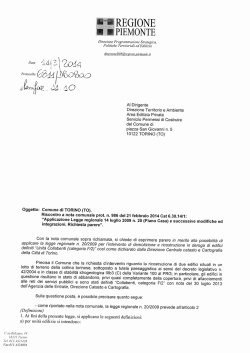
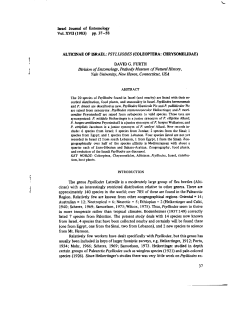
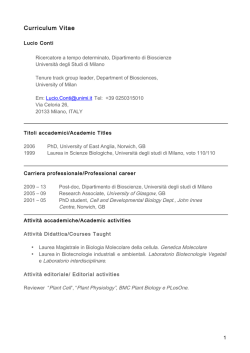
Energies 2012, 5, 3198-3217; doi:10.3390/en5093198 OPEN ACCESS energies ISSN 1996-1073 www.mdpi.com/journal/energies Article Energy from Agricultural and Animal Farming Residues: Potential at a Local Scale Giulia Fiorese 1,2,* and Giorgio Guariso 1 1 2 Dipartimento di Elettronica e Informazione, Politecnico di Milano, via Ponzio 34/5, Milano 20134, Italy; E-Mail: [email protected] FEEM–Fondazione Eni Enrico Mattei, Corso Magenta 63, Milano 20123, Italy * Author to whom correspondence should be addressed; E-Mail: [email protected]; Tel.: +39-02-2399-3559; Fax: +39-02-2399-3412. Received: 31 May 2012; in revised form: 11 August 2012 / Accepted: 16 August 2012 / Published: 28 August 2012 Abstract: Animal wastes from high-density farming have severe impacts on the nitrogen cycle. According to current regulations, the disposal of manure on cropland is constrained by nitrogen content in the agricultural soils. On the contrary, anaerobic digestion (AD) of these wastes can produce energy and a digestate, which is easier to handle than manure and can be applied for agronomic uses. When herbaceous crops are co-digested with manure to increase the efficiency of biogas production, the nitrogen content in the digestate further increases, unless these larger plants are equipped with nitrogen stripping technologies. We propose a model to compare larger (cooperative) and smaller (single parcel) AD conversion plants. The whole process is modeled: from the collection of manures, to the cultivation of energy crops, to the disposal of the digestate. The model maximizes the energy produced on the basis of available biomass, road network, local heat demand and local availability of land for digestate disposal. Results are the optimal size and location of the plants, their technology and collection basins. The environmental performances of such plants are also evaluated. The study has been applied to the province of Forlì-Cesena, an Italian district where animal farming is particularly relevant. Keywords: anaerobic environmental impact digestion; manure management; optimal planning; Energies 2012, 5 3199 1. Introduction The agricultural-zootechnical sector has several impacts on the environment, particularly due to all the wastes generated by animals. Manure is in fact rich in nitrogen and in other nutrients and, when improperly managed, may cause water and soil pollution. There are strict legislations both in the EU and in the USA that aim to control nutrient leaching from manure and from other sources of nitrogen, such as fertilizers (Directive 91/676/EEC and US Clean Water Act). The correct management of manure has thus become an important issue for farming activities (see, for instance, IPCC [1]). Recently, the extraction of biogas in anaerobic digesters (AD) and its use onsite to produce energy have attracted much attention to potential achievements in terms of waste management, greenhouse gases (GHG) reduction and production of energy from renewable sources (see [2] for the development of biogas in EU member states). Biogas can in fact be produced from nearly all kind of biological feedstock and be converted into different forms of energy (electricity or heat, but also mechanical energy in engines). The largest resources are animal manures, slurries and dedicated agricultural crops. The treatment of animal manure also allows avoiding nitrogen leaching, ammonia evaporation and pathogen contamination [3] and the digestate, the final residue of AD, can be used as a fertilizer [4,5]. Typically, manure management and AD plants are designed at the single farm level and these types of applications have been widely studied. For example, Tao and Mancl [6] presented a method to derive the amount of manure produced from the number of animals on-farm and the amount of land needed to dispose of it with respect to its nitrogen, phosphorus and potassium contents. The technical choices and costs related to on-farm management of manure have also been studied for several US production areas, together with the amount of land needed to dispose of manure nutrients [7]. On a more general level, Karkamar et al. [8] reviewed several examples of manure management decision support systems. By contrast, centralized management of manure is much rarer. Denmark is a pioneer in this respect thanks to a national plan that has been developed in 1995 and successfully carried on until nowadays [9–11]. Our aim in this paper is to propose a method to evaluate the potential benefits of a cooperative management of manure. An important benefit that may derive from cooperative plants is the exploitation of economies of scale in the digesters and in the conversion units. On the other side, a cooperative plan requires some degree of coordination [12]. We therefore formulate a mathematical problem to optimize the production of energy from manure via AD at district scale. As the plant capacity increases, economies of scale in capital equipment are realized, but energy costs of transportation also increase as manure and other substrates must be conveyed over longer distances to the plant site. This is particularly relevant for manure because of its high humidity and low energy content. Optimizing plant capacity on the basis of local biomass availability and of transportation distances is thus a key issue. The model allows comparing cooperative (or community) and individual conversion plants, by maximizing the energy produced on the basis of available biomass, road network, local heat demand, and availability of land for digestate disposal. Results are the optimal size and location of the plants as well as their collection basins. The study has been applied to the province of Forlì-Cesena, an Italian district where animal farming is one of the most important economic activities. The environmental impacts are assessed through relevant Energies 2012, 5 3200 indicators: the impact on nitrogen budget, and GHG reduction. Finally, the consequences on the local agriculture system are evaluated comparing the land required to grow the corn silage needed for co-digestion to current land use. 2. The District of Forlì-Cesena The district of Forlì-Cesena (Figure 1) belongs to Emilia-Romagna, an administrative region located in Northern Italy. The district covers an area of 2376 km2. The flat, hilly and mountainous areas account respectively for 29%, 43% and 28% of the total area of the district. The 2011 population was slightly more than 390,000 inhabitants [13]. Figure 1. Map of Forlì-Cesena province. The district’s demand for electrical energy in 2010 was 1904 GWh [14]. The only plants producing electric energy within the district are a waste incinerator and few small hydroelectric plants. Assuming a GHG reduction equal to the national target established within the Kyoto Protocol (−6.5% of 1990 level), the district of Forlì-Cesena has to cut its emissions of about 80 Tg of CO2eq (1990 emissions being 1384 Tg of CO2eq) [15]. This figure will be used here as a reference term, since more recent values are uncertain, particularly for the effects of the current economic crisis. Agriculture, particularly fruit cultures and poultry farming, is a relevant part of the local economy [16]: 20% of the active firms work in this sector, while regional and national incidence is 16%. As shown in Table 1, the 2010 total agricultural area amounts to 1431 km2 (with a 7% decrease with respect to 2000 census). The amount of cropland is 897 km2 (62% of total agricultural area), Energies 2012, 5 3201 while the amount of cropland currently not utilized is 59.4 km2. Furthermore, 21% of the provincial usable agricultural area is devoted to arboriculture and 17% to pastures [17]. Table 1. Land use in the province of Forlì-Cesena [17]. Agricultural area (2010) Cultivated area (2010) Non used Sowable land Arboricolture Vegetable gardens Meadows and pastures Forlì-Cesena [# farms] [km2] 1426.95 893.58 59.4 7219 550.04 6623 190.40 4279 2.55 1227 150.57 Poultry farming contributes to 57% of the provincial agricultural gross product. The main products are broilers (more than three fourth of the total gross product of the district), turkeys and some minor production (such as pigeons, pullets and laying hens and the production of eggs). Swine and bovine farming are also two relevant activities. The number of animal farms and their consistency are shown in Table 2, while their specific location is in Figure 2. Figure 2. Distribution and size of animal farms [18]. Energies 2012, 5 3202 Table 2. Number of animal farms and their consistency in Forlì-Cesena [17]. Forlì-Cesena (2010) Animal farms Bovine Swine Poultry [# farms] 1269 518 181 208 [# animals] 19,453 104,704 17,262,284 Biomass Availability The estimate of the theoretical potential of manure is taken from Make It Be [18], an Intelligent Energy Europe project focused on assessing the potential of agricultural biomass. The amount of available bovine, swine and poultry manure was derived from the local statistics on animal farms and is listed in Table 3 for each municipality, together with the associated nitrogen load. The methane that can be produced by AD process has been determined for each type of manure and the unit yield are listed in Table 4 [18,19]. The lower heating value assumed for methane is 38.2 MJ/m3 [20]. Table 3. Amounts of swine, bovine and poultry manures and their related nitrogen loads per municipality of Forlì-Cesena [18]. Municipality Bagno di Romagna Bertinoro Borghi Castrocaro Cesena Cesenatico Civitella Dovadola Forlì Forlimpopoli Galeata Gambettola Gatteo Longiano Meldola Mercato Saraceno Modigliana Montiano Portico Predappio Swine manure Bovine manure Poultry manure [wet Mg/year] [Mg N/year] [wet Mg/year] [Mg N/year] [wet Mg/year] [Mg N/year] 22,435 70 1,690 84 770 12 47,238 0 19,361 56,557 1,620 12,898 7,473 34,629 9,300 633 3,987 3,508 437 85,530 148 0 61 177 5 40 23 108 29 2 12 11 1 268 482 1,191 362 615 1,461 1,381 166 3,217 376 380 0 0 60 1,352 18 64 8 23 29 75 9 79 11 21 0 0 3 41 1,536 1,380 0 1,962 0 0 0 14,526 0 1,016 1,492 0 616 6,118 29 21 0 32 0 0 0 264 0 18 22 0 9 93 58,099 182 1,056 34 2,468 40 14,236 98 34 6,639 45 0 0 21 213 7 151 1,191 11 0 8 35 0 0 0 100 0 0 0 1 Energies 2012, 5 3203 Table 3. Cont. Swine manure Bovine manure Poultry manure [wet Mg/year] [Mg N/year] [wet Mg/year] [Mg N/year] [wet Mg/year] [Mg N/year] Premilcuore 292 1 687 37 0 0 Rocca S.C. 0 0 465 22 0 0 Roncofreddo 0 0 69 4 0 0 S. Mauro 633 2 0 0 2,156 36 S. Sofia 44 0 767 34 2,020 38 Sarsina 14,815 46 956 26 0 0 Savignano 0 0 765 13 1,785 30 Sogliano 26,928 84 1,528 42 437 7 Tredozio 0 0 195 11 0 0 Verghereto 11,373 36 841 45 1,742 29 Total 438,796 1,373 21,626 789 40,124 680 Municipality Table 4. Methane yield from selected feedstock in the AD process [18,19]. Feedstock Swine manure Bovine manure Poultry manure Corn silage Methane yield [m3 CH4/wet Mg] 12 30 40 110.5 3. Technological Paths for the Energy Conversion of Manure The AD conversion process can take place at several plant capacities. In Germany, the leading country in farm-scale applications, there are almost 4000 plants below 1 MWe [21]. Centralized AD plants’ capacities can go up to several MWe, this configuration is common in Denmark where biogas is produced in collective co-digestion units [10]. In general, animal manure collected from bovine, swine and poultry farms is co-digested with other biomass substrates in order to increase biogas production. Two different plant scales will be analyzed and compared: - single parcel plants with a capacity below 1.04 MWe and - cooperative plants with a capacity larger than 1.04 MWe. Furthermore, we assume that cooperative plants can be coupled with nitrogen removal technologies and specifically with gas stripping (see for instance [22]). This technological solution is feasible only for cooperative plants because it is too expensive at small scales [23]. The conversion plants have been modeled assuming the characteristics of some already in use in other areas. Specifically, the hypotheses concerning the relationship between the size and the efficiency of the plant, and the percentage of electrical and thermal self-consumption are listed in Table 5. According to the framework of the Make It Be project [18], different types of plants have been considered, which work with different feedstock mixes. Type A uses poultry manure with a larger component of swine and bovine manure together with a 50% of corn silage. Type B plants do not use poultry manure and have a 70% of corn silage in their feedstock mix. The formulation presented later Energies 2012, 5 3204 in Section 4 is however general and can take into account more plant types as well as other possible feedstock combinations, with the related biogas production rates. Table 5. Parameters that characterize the conversion plants. Parameter Thermal efficiency Electrical efficiency Single parcel plants Cooperative plants Electrical self-consumption Thermal self-consumption Value [%] 44 37 40 9.5 85 Nitrogen Disposal Human activities have affected in many ways the natural nitrogen cycle. It is estimated that the amount of reactive nitrogen rose from about 15 to 187 Tg of gas from 1860 to 2005. Many processes regulating the complex nitrogen cycle still need to be clearly understood, and there are many uncertainties regarding nitrogen flows [24]. However the human alteration is acknowledged [25] and agriculture significantly contributes through the use of synthetic nitrogen fertilizers and the cultivation of legumes, all processes that fix nitrogen. Furthermore, N2O that is also released after fertilizer application [26] is an important GHG. The 1991 Nitrates EU Directive (Directive 91/676/EEC) designates vulnerable zones (identified as areas of land which drain into polluted or threatened waters) and establishes, among other issues, compulsory measures to control nitrogen pollution. For example, it establishes a maximum amount of animal manure to be applied on cropland. Specifically, it fixes limits of 17 and of 34 Mg N organic/(km2 year) in vulnerable and non-vulnerable zones, respectively. 4. Problem Formulation The problem of optimizing energy production from a network of AD plants in a given territory can be formulated as a mathematical programming problem. The area under investigation must be first discretized in a number of homogeneous parcels, i.e., the distribution of different types of feedstock in each parcel is assumed to be uniform and the transportation distances within each parcel are supposed to be negligible, as far as the overall plan is concerned. In this framework, three types of decision variables can be defined: the amount zijkh of feedstock of type k shipped from parcel i to a plant of type h in parcel j; the amount of digestate xji transported back from plants in parcel j to some parcel i for disposal, and the binary variables yjh = 0,1 determining the presence or not of a plant of type h in parcel j. Note that the possibility of having more plants of the same type in a given parcels (for instance, where the availability of feedstock is particularly high) can be implemented by simply splitting such a rich parcel into two, without modifying the following formulation. We assume the maximization of the energy produced in a given time unit, for instance one year, as the objective function. It can be written as: Energies 2012, 5 3205 max E Aj E Bj e Fk d ij z ijkh e D d ji x ji z, y,x j i k h i (1) where the first term represents the net energy produced by plants in parcel j, the second is the energy needed to transport the feedstock to the plants, and the third is the energy for disposing the digestate back to the fields. More precisely: - EAj and EBj are the net energy productions of plants type A and B in parcel j eFk is the energy for transporting one unit weight of feedstock of type k over a unit distance dij = dji is the distance between parcel i and parcel j eD is the energy for transporting a unit weight of digestate over a unit distance xji is the quantity of digestate produced in parcel j that is shipped back to parcel i. The constraints of the problem are of different types: - Net energy production: E Aj α 1 z ij1A α 2 z ij 2 A α 3 z ij 3A E Bj β1 z ij1B β 2 z ij 2 B j (2) where αk and βk, k = 1,2,3, represent technical coefficients, i.e., the fractions of the different feedstock types for the correct functioning of a plant of type A and B. They include the lower heating value of the related feedstock as well as the overall plant efficiency (provided in Table 5) and the energy used for biomass procurement. - Digestate production: x i ji α 1* z ij1h α *2 z ij 2 h α *3 z ij 3h i j h (3) where α*k, k = 1,2,3, represent the conversion coefficients between mass of feedstock and mass of digestate (normally of the order of 80%–90%). - Feedstock availability: z h ijkh Dik i, k (4) j where Dik represents the availability of feedstock of type k in parcel i (thus in practice, the information analysed in the Section 2.1) - Plant scale: m A y jA E Aj M A y jA mB y jB EBj M B y jB j (5) where mA and MA (and mB and MB) represent the minimum and maximum sizes that the plants of type A (and B) can have to maintain high (and constant) efficiency values. The presence of the binary variable yjh = 0, 1 guarantees the satisfaction of the constraint also in case the plant is not built in parcel j. - Plant technology: z i ij 2 A γ1 zij1A i z i ij 3 A γ 2 zij1A i j for plants type A (6a) Energies 2012, 5 3206 z i ij 3 B γ 3 zij 2 B j for plants type B i (6b) where γi, i = 1, 2, 3 are the proportions of different feedstocks that must be maintained in each type of plant to obtain the best performances. For instance, in the case study that follows, green biomass (k = 3) must be 2.3 times bovine and swine manure (k = 2) for type B plants. - Disposal feasibility: x j ji Ni i (7) where Ni indicates the amount of nitrogen (measured in units of digestate mass) that can be safely disposed of in parcel i, and thus must be larger than the total digestate transported to i from all plants. This may represent, for instance, the compliance with the European Nitrate Directive (91/676/EEC). Problem (1–7) is thus a Mixed Integer Linear Program. In the application considered in the following, the overall number of parcel is 30, while the parcels where a cooperative plant can be located (i.e., of those with a sufficiently high heat demand) are 16. The number of binary variables is thus 24 (there are two types of plants). The number of real variables (the amount of each feedstock shipped from any parcel to those where a plant of type A or B can be located) is thus 3 × 30 × 16 × 2 plus other 30 × 30 for the shipping of the digestate, i.e., slightly less than four thousands. Such a number, which can be handled by many commercial software packages, can be reduced in various ways. Some parcels may not have one or more type of feedstock, or shipping of digestate above a certain distance (assumed 30 kilometers in the case study) may not be allowed. It is also interesting to note that, while the size of each plant can be formally considered as a decision to be taken, it does not correspond to a real decision variable since it can be computed with an equality from the amount of biomass reaching the plant [see Equation (2)]. In quite the same way, Equation (6) allows us to determine, for each plant, the amount of one feedstock type in terms of the others. This means that there is a further reduction of the actual degrees of freedom equal to the number of possible plants. 5. Results The optimization model presented in the previous section has been applied to the province of Forlì-Cesena to describe the full chain of biomass to energy. The model was applied to the cooperative plants and single parcel plants characterized in Section 3. In both cases, biomass is given by all the available manure from swine, bovine and poultry farming, as estimated in Section 2.1. Furthermore, we assume that corn silage needed to co-digest manure in AD plants is available in the quantity needed for the AD process. This assumption will be discussed in the final section. The energy needed to grow corn silage accounts for all needed farming operations [27,28]. Transport distances between municipalities have been derived from the map of the existing road network. The energy cost of transporting biomass is different for corn silage [27] and for manure [29]. Together with energy performance of the system, the model can also provide a carbon balance. The net energy produced may replace an equivalent energy based on fossil fuel, thus sparing the related CO2 emissions. On the other hand, feedstock transport involves a certain amount of GHG emissions, but there are some sources of GHG emissions (notably N2O emissions caused by the use of fertilizers) that must be explicitly added since they do not appear in the energy budget. To compute spared Energies 2012, 5 3207 emissions, we have assumed that the thermal energy from the cooperative plants substitutes that produced by a methane boiler with 80% efficiency (some heating system in Italy works with a much lower efficiency and thus the estimation is definitely conservative) and that the electric energy replaces that of the national grid, again produced from natural gas with an average efficiency of about 39%. We also accounted for the additional emission for unutilized manure and from corn silage cultivation. Specifically, emissions from corn silage are due to farming machines, used for its cultivation and to fertilizer production and application. Emissions from fertilizers are due both to energy requirements for their production and to N2O emissions after application [26–28]. 5.1. Cooperative Plants For the case of cooperative plants, the maximum size of the plants was not constrained, while their minimum size was set to 1 MWe. The optimization results suggest the construction of three facilities in the municipalities of Cesena, Forlì and Meldola with an installed capacity between 1 and 3 MWe. Table 6 shows the details of such results. As apparent from the figures in Table 6, the energy balance is largely positive and the plan may provide about 26% of the electric energy used in the agricultural sector (218 GWh in 2010 [14]). The location and supply basins of the three plants are shown in Figure 3. Table 6. Results of the optimal use of biomass in cooperative plants (yearly values). Cesena Forlì Meldola Total Plant power [MW] 1.85 1.04 2.95 5.83 Net electrical energy [GWhe] 18.0 10.2 28.7 57.1 Net thermal energy [GWht] 3.3 1.9 5.2 10.4 Energy for transport [GWh] 0.29 0.17 0.76 1.23 Net system energy [GWh] 21.0 12.0 33.2 66.3 The cooperative plants produce 19.7 million m3 of biogas from manure and corn silage. All the swine and cattle slurry available is used together with 26,400 Mg of poultry manure, which means about 35% of that available still needs to be disposed of. Table 7 reports where this surplus exists. The reason why poultry manure is not completely utilized is twofold: either the municipality is too far from the cooperative plant and thus the additional energy from manure digestion does not pay for the energy needed for transport (see their location in Figure 3) or plant dimension is constrained by the lack of some other component of the required feedstock mix. Table 7. Residual poultry manure to be disposed of (in Gg N/year). Municipality Borghi Forlì Galeata Gambettola Poultry manure 1.2 10.9 1.2 1.0 Municipality Longiano S. Sofia San Mauro Pascoli Savignano sul Rubicone Total Poultry manure 0.7 3.4 3.0 2.4 23.8 Energies 2012, 5 3208 Figure 3. Supply basins of plants in the towns of Cesena, Forlì and Meldola. The overall energy for transport is just 1.9% of the net production and thus has a very low impact on the overall budget, even if the road network plays an important role in determining plant location and manure shipment. For instance, plants are located in the plain north-eastern part of the province, easier to access than the mountainous area on the opposite side. A portion of the transport energy is due to the additional assumption that also the corn silage is produced in the same municipality as the manure and thus must be shipped to the plants at a certain energy cost. This hypothesis, that in practice translates into applying Equation (6) also to each municipality i, has a double justification. First, the production of corn silage is distributed over the entire district instead of being concentrated close to the plants, producing a more even and acceptable impact on current land use. Second, it allows for an easier comparison with the distributed production scenario that will be analysed in the next section. Additionally, the improvement that may be expected by an intensive cultivation around the plants is less than 1% of the energy budget. It must be noted that, despite the high thermal auto-consumption of these plants, there is still a net heat production, which must find a suitable demand to be effectively used. This means that the plants have to be built within a small distance (one kilometer or so) to an agro-industrial plant or a small district heating system that may exploit the available heat. Table 8 presents an additional detail about the use of available biomass. It shows what is the proportion of the different feedstock types used in either type A or type B plants. Obviously, type A plants are possible only if poultry manure is available and are limited by its quantity. Overall, Table 8 shows that all the available feedstock from swine and bovine manure is used, for about 25% in type A Energies 2012, 5 3209 plants and in type B for the rest. About 115 Gg of corn silage are necessary, 20% of which will be used in type A plants (the percentage necessary for type B plant is higher than in type A). Finally, in Cesena plants, type A represents 19% of the energy produced, in Forlì 49% and in Meldola 24%, meaning that the role of type B plants is prevailing. Table 8. Subdivision of available feedstock for plant types (all values in wet Mg/year). Plant Cesena Forlì Meldola Total Poultry manure 5,955 8,534 11,907 26,396 Type A plants Swine and bovine manure 26,316 37,846 55,522 119,685 Corn silage 5,389 7,723 10,776 23,888 Type B plants Swine and bovine manure 120,869 43,848 176,021 340,737 Corn silage 32,100 11,472 47,872 91,444 5.2. Environmental Impacts As to the nitrogen balance, cooperative plants can be equipped with nitrogen stripping devices to remove it from the digestate. The residues of such plants can thus be disposed of without specific constraints and sometimes can also be sold for their properties as soil amendments. Therefore, the only nitrogen that has to be disposed of is the one coming from the poultry manure that has not been used to produce energy. Its amount is reported in Table 7, and is low enough to be spread on the soil of each municipality without transgressing the normative constraints. Even if nitrogen stripping is not applied (nitrogen to be disposed of coincides with the total in Table 3), the only change is that less than 450 Mg N/year must be sent from Meldola to the neighboring municipality of Civitella di Romagna, with a negligible decrement of the energy budget. The GHG balance mostly resembles the energy one. All GHG flows are presented in Table 9. Its analysis is particularly interesting because it shows the importance of evaluating the plan as a whole and not at the scale of individual municipality. In all but three areas, where the transformation plants are located, the carbon balance is clearly negative meaning that emission of CO2eq due to corn silage cultivation or to excess poultry manure disposal are not compensated. On the contrary, in the three municipalities with the plants, the avoided emissions largely exceed all those related to the feedstock supply chain and thus the overall balance of the plan is extremely positive: avoided emissions are more than nine times those caused by the implementation of the plan. The overall result of about 51 Tg of avoided GHG emission per year would represent more than 64% of the required reduction computed on 1990 data (about 80 Tg CO2eq). 5.3. Single Parcel Plants To understand the role of the various components of the proposed plan and its sensitivity to some of the assumptions, a more classical scenario has been considered, where feedstocks have been supposed to be utilized within each parcel, thus disregarding transportation costs, but also reducing the size and thus the efficiency of the AD plants. The solution obtained under this scenario is depicted in Figure 4. Energies 2012, 5 3210 Table 9. GHG emissions (all values in Mg CO2eq/year). Municipality Bagno di Romagna Bertinoro Borghi Castrocaro Cesena Cesenatico Civitella Dovadola Forlì Forlimpopoli Galeata Gambettola Gatteo Longiano Meldola Mercato Saraceno Modigliana Montiano Portico Predappio Premilcuore Rocca S.C. Roncofreddo S. Mauro S. Sofia Sarsina Savignano Sogliano Tredozio Verghereto Total Avoided emission for electricity 0 0 0 0 11,385 0 0 0 6,346 0 0 0 0 0 18,080 0 0 0 0 0 0 0 0 0 0 0 0 0 0 0 35,811 Avoided emission for heat 0 0 0 0 1012 0 0 0 569 0 0 0 0 0 1607 0 0 0 0 0 0 0 0 0 0 0 0 0 0 0 3188 Emission due to biogas use 0 0 0 0 920 0 0 0 517 0 0 0 0 0 1461 0 0 0 0 0 0 0 0 0 0 0 0 0 0 0 2898 Avoided emission from manure disposal 0 0 0 0 8,744 0 0 0 5,994 0 0 0 0 0 14,265 0 0 0 0 0 0 0 0 0 0 0 0 0 0 0 29,003 Emission from manure transport 0 0 0 0 83 0 0 0 46 0 0 0 0 0 214 0 0 0 0 0 0 0 0 0 0 0 0 0 0 0 343 Emission from Emission from Emission from residual poultry corn silage corn silage manure disposal cultivation transport 0 588.7 0 0 1,065.3 0 175 49.0 0 0 466.8 0 0 1,273.5 21 0 121.5 0 0 376.6 0 0 181.7 0 1338 702.1 12 0 235.9 0 156 26.1 0 155 65.6 0 0 80.8 0 111 9.63 0 0 1,846.6 54 0 1,317.8 0 0 340.1 0 0 2.7 0 0 9.5 0 0 218.2 0 0 46.3 0 0 26.8 0 0 4.0 0 453 10.4 0 364 32.3 0 0 396.3 0 313 31.5 0 0 693.9 0 0 11.2 0 0 253.0 0 3067 10,484 87 Emission balance −589 −1,065 −224 −467 18,843 −121 −377 −182 10,293 −236 −182 −221 −81 −121 30,377 −1,318 −340 −3 −9 −218 −46 −27 −4 −464 −396 −396 −345 −694 −11 −253 51,124 Energies 2012, 5 3211 Figure 4. Map of the model results for the single parcel plants (the power of each plant is shown in kWe). It appears that 18 municipalities do not have enough feedstock to reach a minimum size of 110 kWe (under which plants are not convenient), at least for some of the required components of the mix. Some of them are indeed very small in size, as shown in Figure 4. Under this scenario, which is better detailed in Table 10, the net system energy is still highly positive (about 22% of the overall electric energy used in the agricultural sector), but is 13% less than in the preceding case, despite no energy is used for transportation. Table 10. Results of the optimal use of biomass in single parcel plants (yearly values). Bagno di Romagna Bertinoro Castrocaro Cesena Civitella Forlì Meldola Mercato Saraceno Modigliana Sarsina Sogliano Verghereto Total Plant power [kW] 294 555 217 671 170 486 1041 703 151 180 343 135 4944 Net electrical energy [GWhe] 2.8 5.2 2.1 6.4 1.7 4.9 10.3 6.7 1.5 1.8 3.2 1.5 48.1 Net thermal energy [GWht] 0.6 1.0 0.4 1.2 0.3 0.9 1.9 1.3 0.3 0.4 0.6 0.3 9.2 Energies 2012, 5 3212 Table 11 details the solution in terms of biomass utilization in the two types of plants. Of the 12 parcels where a plant can be built, four can have only a type B plant and one only a type A. Overall, about one fourth of the swine and bovine manure is used in type A plants (which means again the type B is prevailing) and the operation of the entire network requires about 102 Gg of corn silage. Table 11. Subdivision of available feedstock for plant types (all values in wet Mg/year). Plant Bagno di Romagna Bertinoro Castrocaro Cesena Civitella Forlì Meldola Mercato Saraceno Modigliana Sarsina Sogliano Verghereto Total Poultry manure 770 1,536 0 1,962 0 8,534 6,118 2,468 0 0 437 1,742 23,568 Type A plants Swine and bovine manure 3,484 7,564 0 9,657 0 37,846 29,894 12,017 0 0 2,024 7,895 110,381 Corn silage 697 1,390 0 1,776 0 7,723 5,537 2,233 0 0 396 1,577 21,329 Type B plants Swine and Corn bovine manure silage 20,641 5,780 40,156 10,329 19,723 5,135 47,515 12,234 14,279 4,143 0 0 56,988 14,777 47,138 12,264 14,448 3,742 15,771 4,360 26,433 7,238 4,318 1,207 307,411 81,210 5.4. Environmental Impacts Each plant produces a certain amount of nitrogen residual in the digestate. Table 12 shows the amount of nitrogen to be disposed within each municipality (since it is partly due also to unused manure, it differs from zero also in parcels where plants are not planned), and the nitrogen allowed for spreading on cropland (last column). The analysis of these values shows that, at current level, nitrogen disposal does not constitute a problem since cropland where it can be spread is available in all municipalities. This represents a particularly lucky situation of the province, since the same freedom would not be allowed in other areas of Northern Italy. For instance, in the province of Cremona, two hundred kilometers from the area under consideration, the problem is very critical: there, bovine animal farming is predominant and the amount of manure to be disposed of is more than 7 Tg per year [29], i.e., more than ten times that produced in Forlì-Cesena. As for the GHG, the balance is again close to the energy one (Table 13). The decrease of transportation emissions does not balance the reduction in those related to energy, so also for GHG the cooperative solution proves to be superior. Obviously, 18 municipalities have a negative balance, meaning that they have to dispose the manure with the consequent CO2eq emissions without any energy production. They represent about 8% of the overall energy budget and thus there is indeed a strong incentive for them to build one or more cooperative plants. Energies 2012, 5 3213 Table 12. Nitrogen production for the single parcel plants and field capacity (all values in Mg N/year). Municipality N from manure N from corn silage N allowed Bagno di Romagna 166 28 760 Bertinoro 194 50 789 Borghi 85 0 304 Castrocaro Terme 68 22 458 Cesena 232 60 3,222 Cesenatico 34 0 551 Civitella di Romagna 115 18 867 Dovadola 32 0 226 Forlì 451 33 3,114 Forlimpopoli 40 0 322 Galeata 40 0 230 Gambettola 35 0 79 Gatteo 11 0 176 Longiano 14 0 339 Meldola 402 87 959 Mercato Saraceno 256 62 746 Modigliana 56 16 707 Montiano 1 0 132 Portico S. Benedetto 8 0 129 Predappio 57 0 689 Premilcuore 38 0 193 Rocca San Casciano 22 0 366 Roncofreddo 4 0 472 S. Sofia 38 0 184 San Mauro Pascoli 72 0 380 Sarsina 72 19 448 Savignano sul Rubicone 44 0 284 Sogliano al Rubicone 133 33 633 Tredozio 11 0 320 Verghereto 110 12 448 Total 2842 440 18,526 Table 13. GHG emissions (all values in Mg CO2eq/year). Municipality Bagno di Romagna Bertinoro Borghi Castrocaro Avoided emission for electricity Avoided emission for heat Avoided Emission emission from due to manure biogas use disposal Emission from residual manure Emission from corn silage cultivation Balance 1,794 172 157 1,362 0 589 2,584 3,329 0 1,364 313 0 131 285 0 119 2,803 0 1,011 0 326 0 1065 0 467 5,095 −326 1,920 Energies 2012, 5 3214 Table 13. Cont. Municipality Cesena Cesenatico Civitella Dovadola Forlì Forlimpopoli Galeata Gambettola Gatteo Longiano Meldola Mercato Saraceno Modigliana Montiano Portico Predappio Premilcuore Rocca S.C. Roncofreddo S. Mauro S. Sofia Sarsina Savignano Sogliano Tredozio Verghereto Total Avoided emission for electricity 4,041 0 1,101 0 2,911 0 0 0 0 0 6,423 Avoided emission for heat 376 0 106 0 276 0 0 0 0 0 575 Avoided Emission emission from due to manure biogas use disposal 342 3,384 0 0 96 690 0 0 251 3,753 0 0 0 0 0 0 0 0 0 0 523 5,828 Emission from residual manure 0 106 0 390 1338 489 266 540 182 161 0 Emission from corn silage cultivation 1274 0 377 0 702 0 0 0 0 0 1847 Balance 6,186 −106 1,424 −390 4,648 −489 −266 −540 −182 −161 10,457 4,239 393 357 3,584 0 1318 6,540 994 0 0 0 0 0 0 0 0 1,158 0 2,065 0 907 30,326 96 0 0 0 0 0 0 0 0 111 0 199 0 87 2835 87 0 0 0 0 0 0 0 0 101 0 181 0 79 2577 742 0 0 0 0 0 0 0 0 783 0 1,519 0 992 26,452 0 5 4 385 25 7 1 514 465 0 410 0 3 0 5619 340 0 0 0 0 0 0 0 0 396 0 694 0 253 9321 1,405 −5 −4 −385 −25 −7 −1 −514 −465 1,555 −410 2,908 −3 1,654 42,095 6. Discussion and Conclusions The method presented in this work allows determining the size, and location of anaerobic digestion plants as well as their supply basins. The deployment of the cooperative solution would produce a positive net energy and a reduction of GHG emissions higher than in the individual parcel case, without negative impacts on the nitrogen balance. Community plants may also justify the presence of specialized personnel and can thus be easier to manage than a single farm plant, the operation of which may be difficult for the farmers [30]. In the cooperative plan, energy for transportation is only a minor term of the balance and thus the definition of the optimal localization is not very critical: a small shift to a nearby location that appears preferable for other criteria (availability of the area, social acceptance, etc.) does not change significantly the results obtained. Energies 2012, 5 3215 On the other hand, both plans would have a certain impact on agricultural activities. The cooperative plan requires in fact some 115,000 Mg of corn silage, while slightly more than 100,000 would be necessary to feed the single parcel plants. In the Pianura Padana where the province under consideration is located, a typical corn yield is around 50 t/ha. The foreseen plans would thus require that an area between 20 and 23 km2 would be dedicated to grow corn silage. Such a surface constitutes only 2.5% of the agricultural area presently in use or 4% of the sowable land or about half of the cropland currently non used. It thus seems that the impact on current agricultural practice and on the typical local landscape can be minor. The proposed approach is general and studies exist for similar applications and similar complexity, for example for the exploitation of forest biomass [31] or for corn-based ethanol plants [32]. Solutions can be rapidly obtained by current software packages but are strictly site-specific, since they depend on several local factors such as biomass availability, local demand for energy, road network and so on. Furthermore, the proposed approach allows deriving many values of interest for a complete evaluation of the plan. For instance, from the total weight to be shipped to each plant, one may derive the necessary number of trucks and thus judge about the local increase of traffic. For the Forlì plant in the cooperative solution, one may estimate some 6–10 trips per day, depending on the dimension of the trucks. Despite the peculiarities of many of the assumptions, we believe that in farming areas of the dimensions considered here, the results should continue to show that the digestion of various manure types can give a highly positive energy and environmental contribution, and indeed in many regions the number of such plants is rapidly increasing. Acknowledgments This research work has been promoted by CRPV—Centro Ricerche Produzioni Vegetali within the Intelligent Energy Europe EU project “Make It Be” [18] and partly funded by Tecnopolo project, LEAP—Laboratorio Energia e Ambiente Piacenza. The authors thank E. Cozzolino for his contribution and assistance. References 1. 2. 3. 4. The Intergovernmental Panel on Climate Change (IPCC). Climate Change 2007: Synthesis Report. Contribution of Working Groups I, II and III to the Fourth Assessment Report of the Intergovernmental Panel on Climate Change; Pachauri, R.K., Reisinger, A., Eds.; IPCC: Geneva, Switzerland, 2007; pp. 104. EurObserv’ER, 2010. Biogas Barometer. Available online: http://www.eurobserv-er.org (accessed on 27 May 2012). Sørensen, B. Renewable Energy, Its Physics, Engineering, Use, Environmental Impacts, Economy and Planning Aspects; 3rd ed.; Elsevier Science: Oxford, UK, 2004. Tambone, F.; Genevini, P.; D’Imporzano, G.; Adani, F. Assessing amendment properties of digestate by studying the organic matter composition and the degree of biological stability during the anaerobic digestion of the organic fraction of MSW. Bioresour. Technol. 2009, 100, 3140–3142. Energies 2012, 5 5. 6. 7. 8. 9. 10. 11. 12. 13. 14. 15. 16. 17. 18. 19. 3216 Tani, M.; Sakamoto, N.; Kishimoto, T.; Umetsu, K. Utilization of anaerobically digested dairy slurry combined with other wastes following application to agricultural land. Int. Congr. Ser. 2006, 1293, 331–334. Tao, J.; Mancl, K. Estimating Manure Production, Storage Size, and Land Application Area. In Agriculture and Natural Resources Fact Sheet; The Ohio State University: Columbus, OH, USA, 2008. Ribaudo, M.; Gollehon, N.; Aillery, M.; Kaplan, J.; Johansson, R.; Agapoff, J.; Christensen, L.; Breneman, V.; Peters, M. Manure Management for Water Quality: Costs to Animal Feeding Operations of Applying Manure Nutrients to Land, U.S.; Agricultural Economic Report 824, Department of Agriculture, Economic Research Service, Resource Economics Division: Washington, DC, USA, 2003. Karmakar, S.; Laguë, C.; Agnew, J.; Landry, H. Integrated decision support system (DSS) for manure management: A review and perspective. Comput. Electron. Agric. 2007, 57, 190–201. Gregersen, K.H. Danish Experience with AD Plants and Future Direction. In Proceedings of Got Manure? Enhancing Environmental and Economic Sustainability, New York, NY, USA, 28–29 March 2012; pp. 19–27. Available online: http://www.ansci.cornell.edu/prodairy/gotmanure/ index.html (accessed on 1 May 2012). Raven, R.P.J.M.; Gregersen, K.H. Biogas plants in Denmark: Successes and setbacks. Renew. Sustain. Energy Rev. 2007, 11, 116–132. Angelidaki, I.; Ellegaard, L. Codigestion of manure and organic wastes in centralized biogas plants, Status and Future Trends. Appl. Biochem. Biotechnol. 2003, 109, 95–105. Ghafoori, E.; Flynn, P.C.; Feddes, J.J. Pipeline vs. truck transport of beef cattle manure. Biomass Bioenergy 2007, 31, 168–175. Censimento popolazione e abitazioni 2011; Istituto Nazionale di Statistica (ISTAT): Rome, Italy, 2011. Terna. Dati Statistici sull’energia elettrica in Italia, 2011. Available online: http://www.terna.it (accessed on 29 May 2012). Provincia di Forlì-Cesena. Piano Energetico Ambientale della Provincia di Forlì-Cesena; Provincia di Forlì-Cesena: Cesena, Italy, 2008. Camera di Commercio dell’Industria, Artigianato e Agricoltura (CCIAA). Rapporto sull’economia della Provincia di Forlì-Cesena; Camera di Commercio di Forlì-Cesena: Forlì, Italy, 2011. 6° Censimento Generale dell’Agricoltura 2010; Istituto Nazionale di Statistica (ISTAT): Rome, Italy, 2012. Make It Be (MIB). Decision making and implementation tools for delivery of local & regional bio-energy chains, 2011. Available online: http://www.makeitbe.eu/ (accessed on 1 January 2012). Reale, F.; Stolica, R.; Gaeta, M.; Ferri, M.; Sarnataro, M.; Vitale, V. Analisi e Stima Quantitativa della Potenzialità di Produzione Energetica da Biomassa Digeribile a Livello Regionale. In Studio e Sviluppo di un Modello per Unità Energetiche, Parte 1–Metodologia, Ricerca Sistema Elettrico; Report RSE/2009/182; ENEA and Ministero dello Sviluppo Economico: Rome, Italy, 2009. Energies 2012, 5 3217 20. Supple, D. Units & Conversions Fact Sheet, MIT Energy club, 2007. Available online: http://www.mitenergyclub.org/assets/2008/11/15/Units_ConvFactors.MIT_EnergyClub_Factsheet v8.pdf (accessed on 20 July 2012). 21. EurObserv’ER. Biogas Barometer, 2008. Available online: http://www.eurobserv-er.org (accessed on 20 May 2012). 22. Walker, M.; Iyer, K.; Heaven, S.; Banks, C.J. Ammonia removal in anaerobic digestion by biogas stripping: An evaluation of process alternatives using a first order rate model based on experimental findings. Chem. Eng. J. 2011, 178, 138–145. 23. Orentlicher, M. Overview of Nitrogen Removal Technologies and Application/Use of Associated end Products. In Proceedings of Got Manure? Enhancing Environmental and Economic Sustainability Conference, New York, NY, USA, 28–29 March 2012; pp. 148–158. Available online: http://www.ansci.cornell.edu/prodairy/gotmanure/index.html (accessed on 1 May 2012). 24. Galloway, J.N.; Townsend, A.R.; Willem Erisman, J.; Bekunda, M.; Cai, Z.; Freney, J.R.; Martinelli, L.A.; Seitzinger, S.P.; Sutton, M.A. Transformation of the nitrogen cycle: Recent trends, questions, and potential solutions. Science 2008, 320, 889–892. 25. Vitousek, P.M.; Aber, J.D.; Howarth, R.W.; Likens, G.E.; Matson, P.A.; Schindler, D.W.; Schlesinger, W.H.; Tilman, D.G. Human alteration of the global nitrogen cycle: Causes and consequences. Issues Ecol. 1997, 1, 1–15. 26. Crutzen, P.J.; Mosier, A.R.; Smith, K.A.; Winiwarter, W. N2O release from agro-biofuel production negates global warming reduction by replacing fossil fuels. Atmos. Chem. Phys. 2008, 8, 389–395. 27. Fiorese, G.; Guariso, G. A GIS-based approach to evaluate biomass potential from energy crops at regional scale. Environ. Model. Softw. 2010, 25, 702–711. 28. Borghi, F.; Viva, G. Corso di Basi Economiche, Contabili e Gestionali; REDA Edizioni: Torino, Italy, 2007. 29. Fiorese, G.; Guariso, G.; Polimeni, A. Optimizing Biogas Production: An Application to an Italian Farming District. In Proceedings of the iEMSs 2008. International Environmental Modelling and Software Society, Sànchez-Marrè, M., Béjar, J., Comas, J., Rizzoli, A.E., Guariso, G., Eds.; Barcelona, CA, USA, 7–10 July 2008; pp. 1289–1296. 30. Labatut, R.A.; Gooch, C.A. Monitoring of Anaerobic Digestion Process to Optimize Performance and Prevent System Failure. In Proceedings of Got Manure? Enhancing Environmental and Economic Sustainability, New York, NY, USA, 28–29 March 2012; pp. 209–225. Available online: http://www.ansci.cornell.edu/prodairy/gotmanure/index.html (accessed on 1 May 2012). 31. Freppaz, D.; Minciardi, R.; Robba, M.; Rovatti, M.; Sacile, R.; Taramasso, A. Optimizing forest biomass exploitation for energy supply at a regional level. Biomass Bioenergy 2004, 26, 15–25. 32. Karuppiah, R.; Peschel, A.; Grossmann, I.E.; Martín, M.; Martinson, W.; Zullo, L. Energy optimization for the design of corn-based ethanol plants. AIChE J. 2008, 54, 1499–1525. © 2012 by the authors; licensee MDPI, Basel, Switzerland. This article is an open access article distributed under the terms and conditions of the Creative Commons Attribution license (http://creativecommons.org/licenses/by/3.0/).
© Copyright 2026 Paperzz